

Neural changes in control implementation of a continuous task
- PMID: 17360924
- PMCID: PMC6672580
- DOI: 10.1523/JNEUROSCI.5051-06.2007
Neural changes in control implementation of a continuous task
Abstract
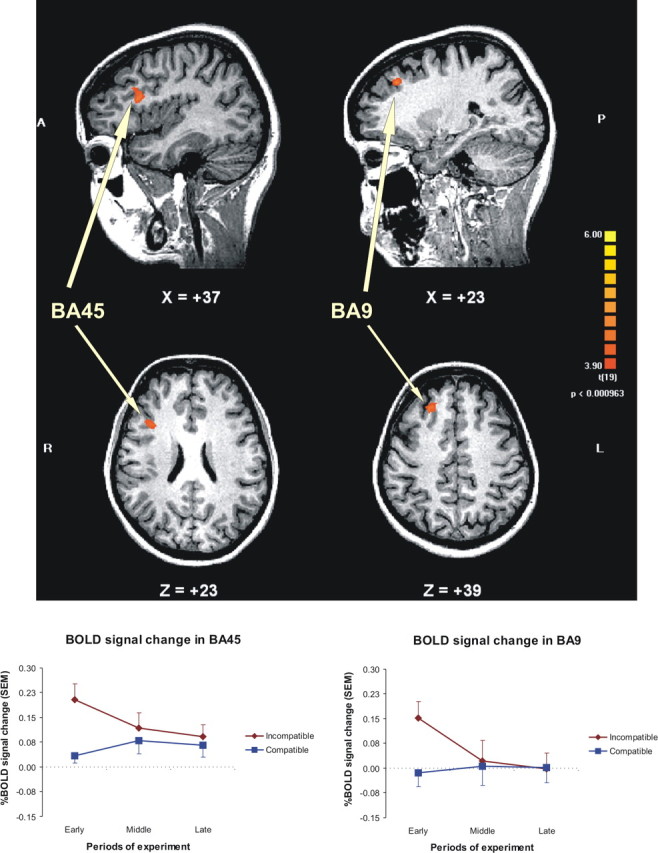
It is commonly agreed that control implementation, being a resource-consuming endeavor, is not exerted continuously or in simple tasks. However, most research in the field was done using tasks that varied the need for control on a trial-by-trial basis (e.g., Stroop, flanker) in a discrete manner. In this case, the anterior cingulate cortex (ACC) was found to monitor the need for control, whereas regions in the prefrontal cortex (PFC) were found to be involved in control implementation. Whether or not the same control mechanism would be used in continuous tasks was an open question. In our study, we found that in a continuous task, the same neural substrate subserves control monitoring (ACC) but that the neural substrate of control implementation changes over time. Early in the task, regions in the PFC were involved in control implementation, whereas later the control was taken over by subcortical structures, specifically the caudate. Our results suggest that humans possess a flexible control mechanism, with a specific structure dedicated to monitoring the need for control and with multiple structures involved in control implementation.
Figures


Similar articles
-
Dissociating the roles of the rostral anterior cingulate and the lateral prefrontal cortices in performing two tasks simultaneously or successively.Cereb Cortex. 2003 Apr;13(4):329-39. doi: 10.1093/cercor/13.4.329. Cereb Cortex. 2003. PMID: 12631562
-
Anterior cingulate and prefrontal cortex activity in an FMRI study of trial-to-trial adjustments on the Simon task.Neuroimage. 2006 Oct 15;33(1):399-405. doi: 10.1016/j.neuroimage.2006.06.012. Epub 2006 Jul 28. Neuroimage. 2006. PMID: 16876434
-
Reactive mechanism of cognitive control system.Cereb Cortex. 2010 Nov;20(11):2675-83. doi: 10.1093/cercor/bhq013. Epub 2010 Feb 12. Cereb Cortex. 2010. PMID: 20154012
-
The best of a bad bunch: the ventromedial prefrontal cortex and dorsal anterior cingulate cortex in decision-making.J Neurosci. 2007 Jan 17;27(3):447-8. doi: 10.1523/jneurosci.4967-06.2007. J Neurosci. 2007. PMID: 17240549 Free PMC article. Review. No abstract available.
-
Limitations in information processing in the human brain: neuroimaging of dual task performance and working memory tasks.Prog Brain Res. 2000;126:95-102. doi: 10.1016/S0079-6123(00)26009-3. Prog Brain Res. 2000. PMID: 11105642 Review. No abstract available.
Cited by
-
Language and task switching in the bilingual brain: Bilinguals are staying, not switching, experts.Neuropsychologia. 2015 Jan;66:193-203. doi: 10.1016/j.neuropsychologia.2014.10.037. Epub 2014 Nov 14. Neuropsychologia. 2015. PMID: 25446970 Free PMC article.
-
Individual differences in typical reappraisal use predict amygdala and prefrontal responses.Biol Psychiatry. 2009 Mar 1;65(5):367-73. doi: 10.1016/j.biopsych.2008.09.007. Epub 2008 Oct 18. Biol Psychiatry. 2009. PMID: 18930182 Free PMC article.
-
Double dissociation between action-driven and perception-driven conflict resolution invoking anterior versus posterior brain systems.Neuroimage. 2009 Nov 1;48(2):381-90. doi: 10.1016/j.neuroimage.2009.06.058. Epub 2009 Jun 30. Neuroimage. 2009. PMID: 19573610 Free PMC article.
-
An Activation Likelihood Estimation Meta-Analysis of How Language Balance Impacts the Neural Basis of Bilingual Language Control.Brain Sci. 2025 Jul 28;15(8):803. doi: 10.3390/brainsci15080803. Brain Sci. 2025. PMID: 40867137 Free PMC article. Review.
-
Subcortical processes of motor response inhibition during a stop signal task.Neuroimage. 2008 Jul 15;41(4):1352-63. doi: 10.1016/j.neuroimage.2008.04.023. Epub 2008 Apr 11. Neuroimage. 2008. PMID: 18485743 Free PMC article.
References
-
- Adam JJ, Backes W, Rijcken J, Hofman P, Kuipers H, Jolles J. Rapid visuomotor preparation in the human brain: a functional MRI study. Brain Res Cogn Brain Res. 2003;16:1–10. - PubMed
-
- Barch DM, Braver TS, Sabb FW, Noll DC. Anterior cingulate and the monitoring of response conflict: evidence from an fMRI study of overt verb generation. J Cogn Neurosci. 2000;12:298–309. - PubMed
-
- Botvinick M, Nystrom LE, Fissell K, Carter CS, Cohen JD. Conflict monitoring versus selection-for-action in anterior cingulate cortex. Nature. 1999;402:179–181. - PubMed
-
- Botvinick MM, Braver TS, Barch DM, Carter CS, Cohen JD. Conflict monitoring and cognitive control. Psychol Rev. 2001;108:624–652. - PubMed
-
- Botvinick MM, Cohen JD, Carter CS. Conflict monitoring and anterior cingulate cortex: an update. Trends Cogn Sci. 2004;8:539–546. - PubMed
Publication types
MeSH terms
Grants and funding
LinkOut - more resources
Full Text Sources
Miscellaneous