Comparative Study
. 2007 Mar 14;27(11):3017-29.
doi: 10.1523/JNEUROSCI.4037-06.2007.

Brain-derived neurotrophic factor promotes long-term potentiation-related cytoskeletal changes in adult hippocampus

Affiliations
Comparative Study

Brain-derived neurotrophic factor promotes long-term potentiation-related cytoskeletal changes in adult hippocampus

Christopher S Rex et al. J Neurosci. .

Abstract

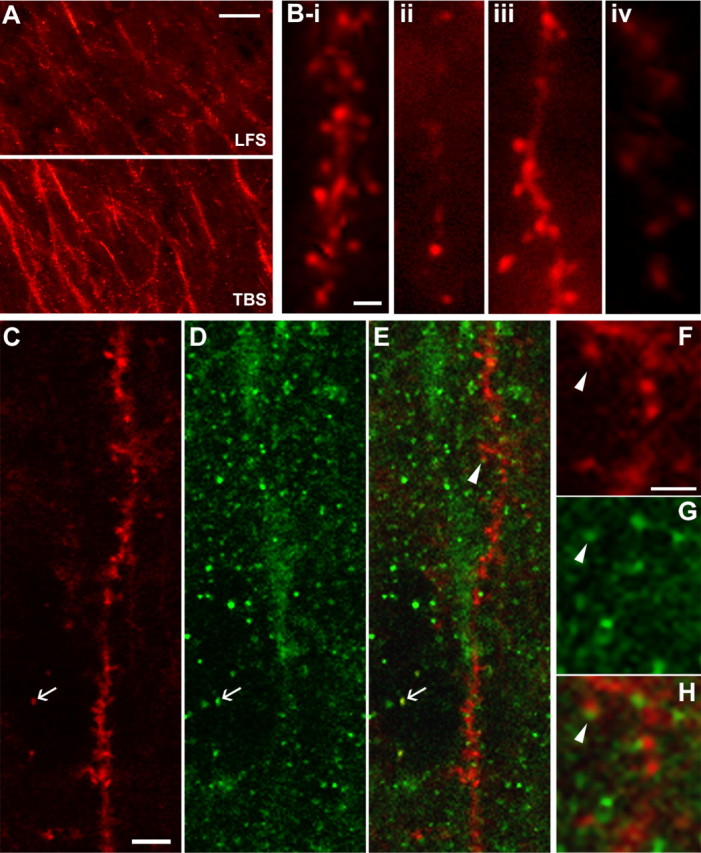
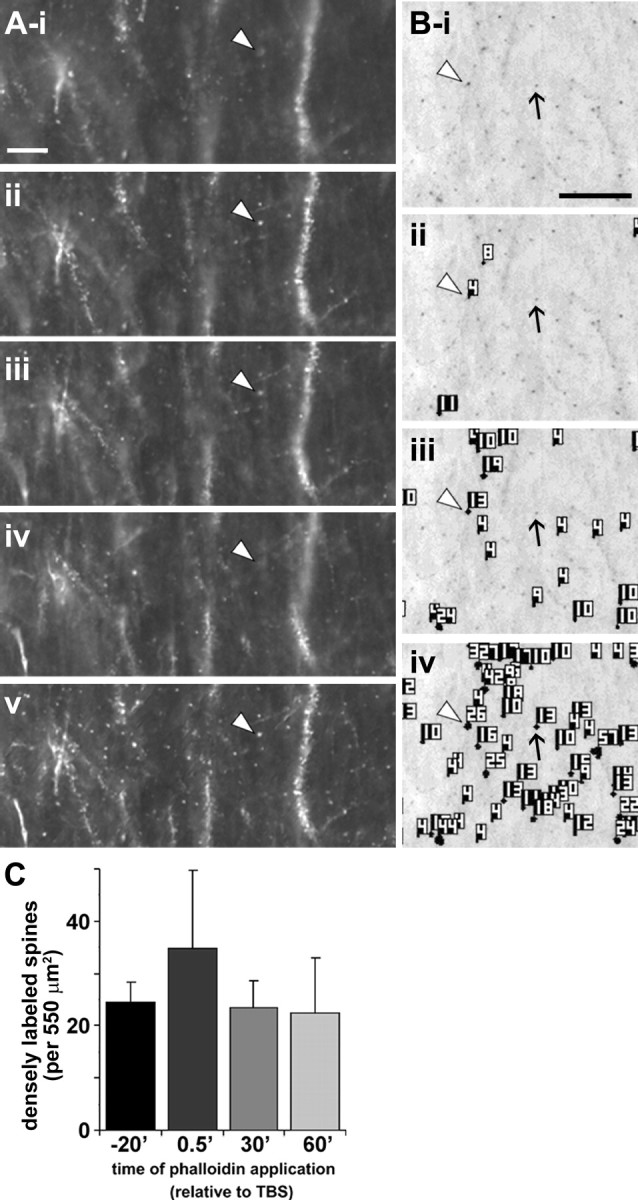
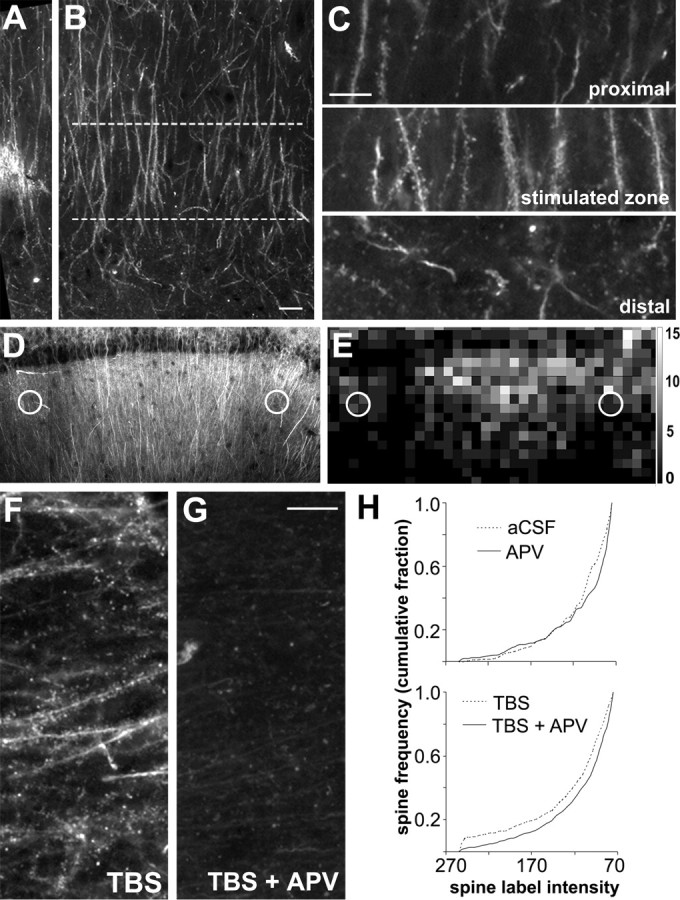
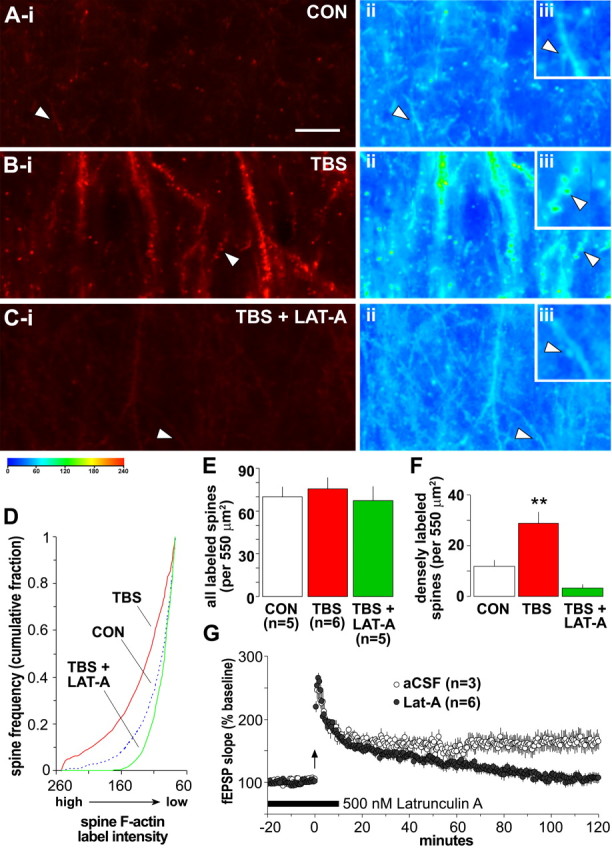
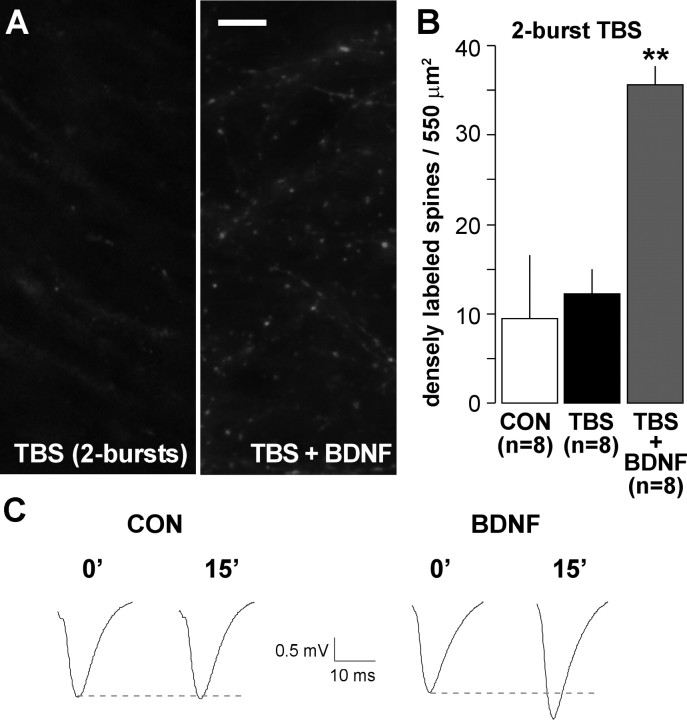
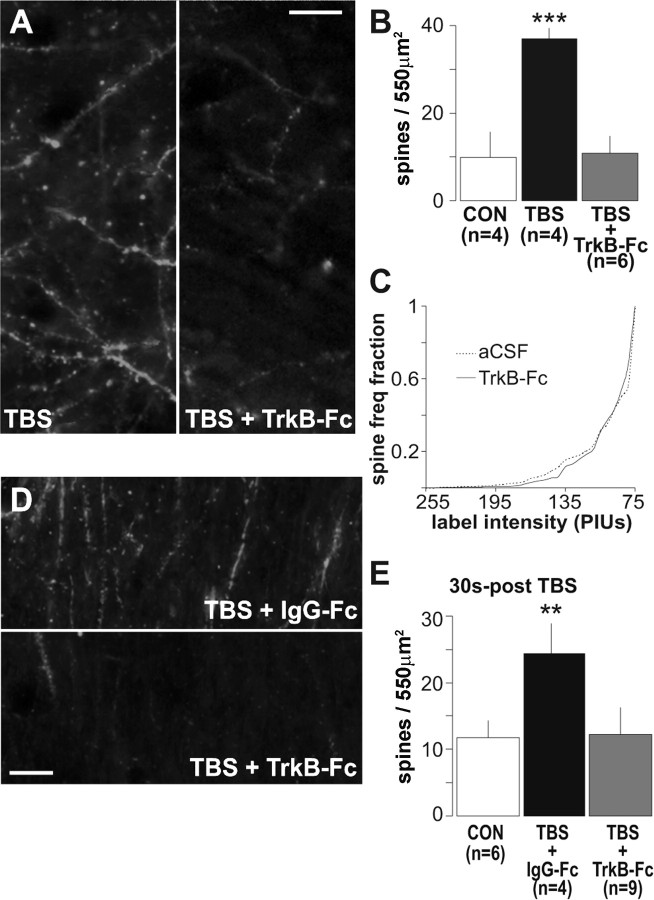
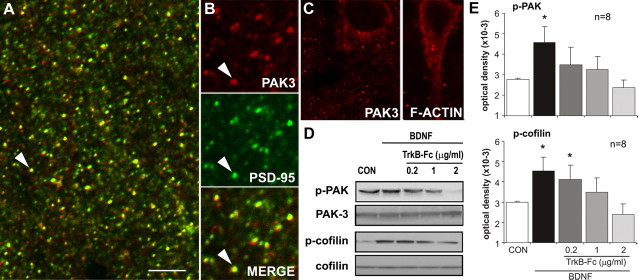
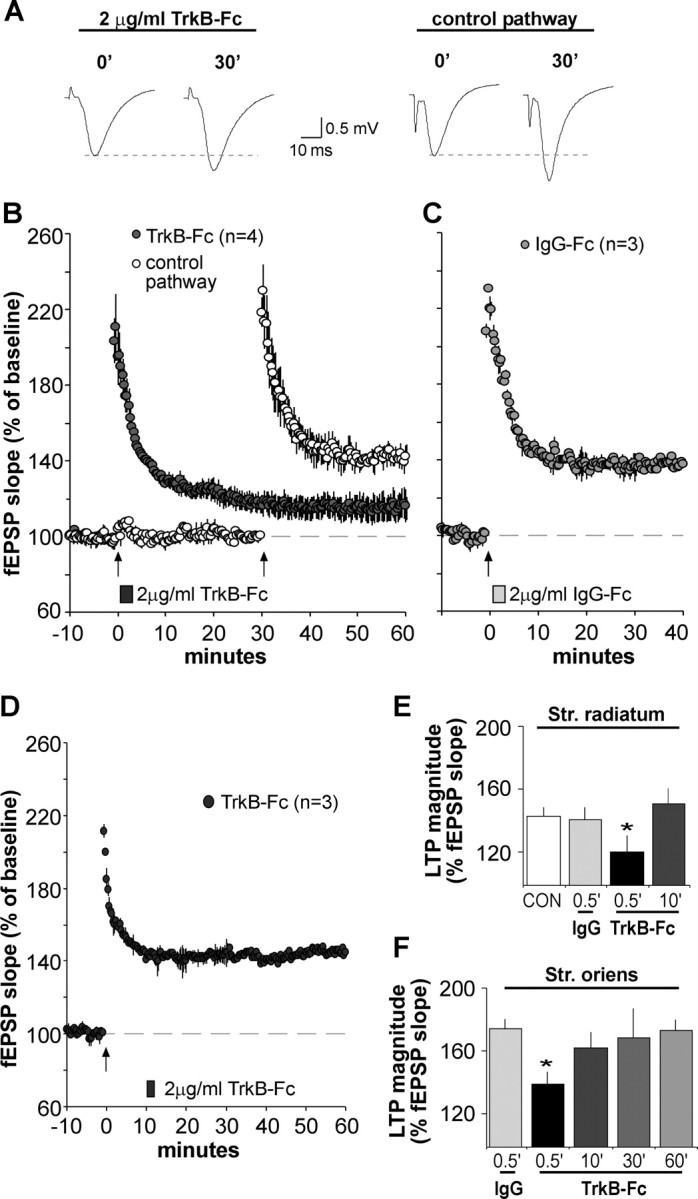
Brain-derived neurotrophic factor (BDNF) is an extremely potent, positive modulator of theta burst induced long-term potentiation (LTP) in the adult hippocampus. The present studies tested whether the neurotrophin exerts its effects by facilitating cytoskeletal changes in dendritic spines. BDNF caused no changes in phalloidin labeling of filamentous actin (F-actin) when applied alone to rat hippocampal slices but markedly enhanced the number of densely labeled spines produced by a threshold level of theta burst stimulation. Conversely, the BDNF scavenger TrkB-Fc completely blocked increases in spine F-actin produced by suprathreshold levels of theta stimulation. TrkB-Fc also blocked LTP consolidation when applied 1-2 min, but not 10 min, after theta trains. Additional experiments confirmed that p21 activated kinase and cofilin, two actin-regulatory proteins implicated in spine morphogenesis, are concentrated in spines in mature hippocampus and further showed that both undergo rapid, dose-dependent phosphorylation after infusion of BDNF. These results demonstrate that the influence of BDNF on the actin cytoskeleton is retained into adulthood in which it serves to positively modulate the time-dependent LTP consolidation process.


Figures

Figure 1.
Figure 1.
Theta burst stimulation increases F-actin labeling in adult dendritic spines. A, Low-power photomicrographs of F-actin labeling in field CA1 of hippocampal slices that received topical rhodamine–phalloidin followed by either low-frequency stimulation (LFS, top) or LTP-inducing TBS (bottom). Scale bar, 10 μm. B, High-magnification images of dendritic spines labeled with rhodamine–phalloidin. i–iii show typical labeling after theta burst stimulation: spine heads were often observed clustered along a weakly labeled dendritic process (i, iii) but also occurred in isolation (ii, iii). iv shows typical labeling in a slice that received only low-frequency stimulation. Scale bar, 2 μm. C–H, Colocalization of rhodamine–phalloidin with PSD-95-IR as assessed with laser scanning confocal microscopy. C–E, In situ phalloidin labeling (C), PSD-95 immunostaining (D), and an overlay of the two (E) for a region of CA1 str. radiatum in a TBS slice. Colocalization took two forms: a PSD-95-immunoreactive cap on the tip of an F-actin-positive spine (arrowhead in E) or superimposition of the two labels (see arrow in C–E). F–H show the region around the arrowhead in E at higher magnification (arrowhead indicates same location in E–H) to illustrate the PSD-95 capping effect. Scale bars: (in C) C, D, 5 μm; (in F) F–H, 2 μm.
Figure 2.
Figure 2.
Spine detection analysis procedure for in situ rhodamine–phalloidin labeling. Panels illustrate the spine detection analytical technique for a representative phalloidin-labeled field. After experimental treatment (rhodamine–phalloidin infusion, stimulation), slices were fixed and sectioned at 20 μm to assess dendritic spine labeling. A, For each section analyzed, a series of wide-field photomicrographs were collected at regular, sequential z-axis planes (i–iv) and collapsed using extended focal imaging (v) to eliminate out-of-focus noise and permit accurate spine quantification through the z-axis of the slice. Scale bar: (in i) i–v, 10 μm. B, Representative photomicrograph (i) shows collapsed Z-series images from a slice given only low-frequency stimulation. For spine analysis, image pixel intensity was inverted so that rhodamine-labeled elements appear as dark puncta. ii–iv show spine detection software output for three pixel intensity threshold levels (with decreasing thresholds from ii–iv): the analysis software identified greater numbers of spines as intensity threshold was lowered. Note that intensely labeled spines (e.g., spine at arrowhead in Bi) are detected, and identified with an object number, at all threshold levels, whereas faintly labeled spines (arrow) are only detected when the intensity filter is set very low (iv). Scale bar: (in i), i–iv, 10 μm. C, Bar graph shows group mean ± SEM counts of intensely labeled spine-like puncta within the 550 μm2 sample region for hippocampal slices infused for 20 min with rhodamine–phalloidin beginning 20 min before TBS (−20′) or 0.5, 20, or 60 min after TBS (spines detected at high threshold, 145 PIU levels only). There were no significant differences in labeled spine counts between groups (p > 0.7, one-way ANOVA).
Figure 3.
Figure 3.
TBS-induced F-actin labeling is spatially restricted and blocked by an NMDA receptor antagonist. A, B, Low-power photomicrographs of CA1 str. radiatum in an adult hippocampal slice labeled with rhodamine–phalloidin in situ. Bright labeling in the middle of A marks the location of the stimulation electrode (40–60 μm below surface of slice) in the mid-distal portion of str. radiatum. The lamina aligned with the proximodistal position of the stimulation electrodes is outlined (between dashed lines) in B. Scale bar: (in B) A, B, 10 μm. C, Enlargements of the stimulated zone (middle) and adjacent proximal (top) and distal (bottom) regions from B show that robust spine labeling is restricted to lamina containing the stimulated afferents. Scale bar, 10 μm. D, Photomicrograph of hippocampal field CA1 from a slice that received TBS; stimulation electrode placements are indicated by white circles. E, Spatial frequency map plots the distribution of intensely labeled spine numbers (>145 PIU) across 10 × 10 μm sampling zones for the hippocampal field shown in D. Intensely labeled spine frequencies are represented by grayscale intensity. Grayscale calibration bar (at right) shows number of spines per sampling region represented by the different gray levels. F, G, Photomicrographs of sample regions taken from phalloidin-labeled slices receiving TBS in the presence of aCSF alone (TBS) or together with 100 μm APV (TBS + APV). Scale bar, 10 μm. H, Top graph describes cumulative fraction of spine counts across the full range of label pixel intensities within the 550 μm2 sampling zone for control unstimulated slices (aCSF, dashed line) versus slices treated with APV (solid line). Bottom graph plots same distribution for slices stimulated with TBS in aCSF (dashed line) compared with slices receiving TBS in the presence of APV (solid line).
Figure 4.
Figure 4.
TBS-induced increases in the number of densely labeled spines are reversed by latrunculin A. A–C, Left, Photomicrographs of 550 μm2 sample regions taken with low-intensity illumination, from in situ phalloidin-labeled slices that received either baseline stimulation (CON), TBS, or TBS in the presence of 500 nm latrunculin A (LAT-A). Note that TBS caused a marked increase in structures containing dense phalloidin labeling of F-actin and that this effect was eliminated by latrunculin A. Pseudocolor representations of label density (PIU calibration at bottom) for these three sections are shown to the right (ii and iii in A–C). The control (Aii) has numerous lightly labeled (blue end of spectrum) puncta that, at higher magnification (inset, Aiii), can be seen to be spines. The TBS slice with potentiated synapses (Bii, Biii) has numerous green to yellow puncta, indicative of dense labeling; these profiles are absent in the latrunculin A-treated slice (Cii, Ciii) that also received TBS. Scale bar: (in A) Ai–Ci, Aii–Cii, 10 μm; Aiii–Ciii, 5 μm. D, Plot describes spine frequency (expressed as a cumulative fraction of the total number of labeled spines) as a function of mean spine label intensity for groups of slices receiving baseline/control stimulation (CON, blue dashed line), TBS (red solid line), or TBS in the presence of 500 nm latrunculin A (green solid line). The intensity distribution for TBS-treated slices is significantly shifted toward high-intensity labeling compared with controls (K–S test, D = 0.25; p < 0.0001), whereas latrunculin A-treated slices exhibited almost no intensely labeled spines (K–S test vs controls, D = 0.10; p < 0.01). E, Bar graph plots group mean ± SEM values for the total number of identifiable spines (with label intensity of ≥75 PIU) from the independent experiments contributing to data plotted in D: the total number of labeled spines did not differ across treatment groups (p > 0.7, one-way ANOVA). F, Graph shows group mean ± SEM values for numbers of intensely labeled spines (label intensity of ≥145 PIU) from independent experiments contributing to data plotted in D: values demonstrate that infusion of latrunculin A before TBS eliminated the presence of intensely labeled spines normally produced by TBS (**p < 0.01, two-tailed t test vs control group). G, Graph shows fEPSP slopes recorded from control slices (aCSF, open circles) or those receiving bath application of 500 nm latrunculin A (filled circles) for 30 min beginning 20 min before TBS (arrow). In latrunculin A-treated slices, LTP was significantly attenuated by 2 h after TBS compared with aCSF controls (p < 0.01, two-way repeated-measures ANOVA for minutes 100–120).
Figure 5.
Figure 5.
BDNF lowers the threshold for TBS-induced increases in spine F-actin. Hippocampal slices were treated with rhodamine–phalloidin for 20 min, after which baseline responses were collected and then TBS was applied. A, Photographs of rhodamine–phalloidin labeling show that two theta bursts did not increase numbers of densely labeled spines when applied alone (left) but did so when applied in the presence of 2 nm BDNF (right). Scale bar, 10 μm. B, Group data (mean ± SEM) confirm that slices receiving two theta bursts alone (TBS) had comparable numbers of F-actin dense spines as those receiving only baseline stimulation (CON; p > 0.3, two-tailed t test), whereas slices treated with two theta bursts in the presence of 2 nm BDNF (TBS + BDNF) had approximately threefold greater numbers of intensely labeled spines (**p < 0.01 vs TBS alone). C, Field EPSPs recorded immediately before (0′) and 15 min after (15′) delivery of two theta bursts to slices receiving aCSF (CON) or BDNF infusion (initiated 20 min before recordings).
Figure 6.
Figure 6.
Sequestering extracellular BDNF prevents TBS-induced actin polymerization. A, Representative photomicrographs of the CA1 sampling region shows a scattering of densely phalloidin-labeled spines in a slice given TBS alone and the absence of dense spine labeling in a slice given TBS in the presence of 1 μg/ml TrkB-Fc (TBS + TrkB-Fc; scale bar, 10 μm). B, A plot of group mean ± SEM spine counts confirms that TBS markedly increased numbers of intensely labeled spines relative to controls (CON; ***p = 0.001, two-tailed t test) and that this effect was blocked by TrkB–Fc (p > 0.8 vs controls). C, Cumulative fraction spine intensity plots (as in Fig. 3H) show similar intensity distributions for phalloidin-labeled spines for control slices maintained in aCSF (dashed line) and slices treated with 1 μg/ml TrkB–Fc alone (solid line; i.e., in the absence of TBS): no differences between TrkB–Fc and aCSF slices were detected (p > 0.8, two-way repeated-measures ANOVA). D, Photomicrographs of rhodamine–phalloidin labeling in field CA1 in slices receiving the control Ig, IgG–Fc (TBS + IgG–Fc), or 2 μg/ml TrkB–Fc (TBS + TrkB–Fc) for 2 min starting 30 s after TBS. E, Quantification of densely labeled spines shows that post-TBS application of IgG–Fc did not block theta-induced increases in the number of intensely labeled spines (**p < 0.01 vs control, two-tailed t test), whereas post-TBS infusion of TrkB–Fc eliminated the effect.
Figure 7.
Figure 7.
Exogenous BDNF promotes phosphorylation of actin regulatory proteins. A, High-power confocal micrograph shows anti-PSD-95 (green) and anti-PAK3 (red) double labeling in field CA1 (double-labeled elements appear yellow). Both markers labeled discrete puncta scattered throughout str. radiatum. Scale bar: A, 5 μm; B, 3 μm. B, Enlargements of the field including the arrow in A separated into red (PAK3), green (PSD-95), and overlaid (Merge) channels (A is a “merged” image) show that most, but not all, PAK3-immunoreactive puncta also contain PSD-95-IR. C, Micrographs show perinuclear localization of PAK3-IR (left) and phalloidin-labeled F-actin (right). D, E, Adult rat hippocampal slices were treated with BDNF (60 ng/ml; bath applied) for 30 min alone or with TrkB–Fc pretreatment. Representative Western blots (D) show treatment effects on p-PAK immunoreactivity (detects the conserved phosphorylation site on p-PAK isoforms 1, 2, and 3) with no evident changes in total PAK3. BDNF-induced increases in p-PAK were eliminated by TrkB–Fc in a dose-dependent manner. BDNF similarly increased, and TrkB–Fc similarly reduced, levels of p-cofilin without effects on total cofilin content. E, Quantification of Western blots assessing BDNF treatment effects on p-PAK (top) and p-cofilin (bottom) immunoreactivities, with and without TrkB–Fc cotreatment (group mean ± SEM band densities shown; n = 8 per group). In each case, BDNF-induced increases in the phosphoproteins (*p < 0.05 vs control, one-way ANOVA followed by Tukey's HSD test) were blocked by TrkB–Fc at concentrations from 0.2–2 μg/ml for p-PAK and 1–2 μg/ml for p-cofilin.
Figure 8.
Figure 8.
BDNF scavenger TrkB–Fc applied after theta burst stimulation disrupts LTP consolidation. A, Representative fEPSP traces show that the degree of synaptic potentiation produced by a conventional theta burst train was attenuated when TrkB–Fc (2 μg/ml) was applied for 2 min beginning 30 s after TBS. Traces at right (2 μg/ml TrkB–Fc) were collected during baseline (0′) and 30 min after TBS (30′). The experiment was repeated using a second population of synapses (control pathway; traces at left) after the scavenger had been washed out for 27 min. In this case, normal TBS-induced potentiation (30min after TBS) was obtained. B, Plot shows group fEPSP slopes (means ± SEM) for experiments described above. Note that potentiation for the pathway receiving post-TBS TrkB–Fc treatment (filled circles), although initially robust, decayed significantly compared with potentiation in the control pathway (open circles); arrow here and in later panels indicates placement of TBS. C, Same as in B except that the control IgG–Fc (2 μg/ml) was infused 30 s after TBS; this had no effect on LTP. D, TrkB–Fc infused for 2 min starting 10 min after TBS had no effect on LTP. E, F, Summary of the percentage of LTP obtained with post-induction infusion of TrkB–Fc or IgG–Fc: values are percentage change from baseline measured 30 min after infusion onset; tests performed in apical (str. radiatum) and basal (str. oriens) dendrites are summarized in E and F, respectively. For both lamina, TrkB–Fc attenuated LTP expression when applied 30 s after TBS compared with potentiation attained in IgG–Fc-treated controls (*p < 0.05, two-way repeated-measures ANOVA followed by Tukey's HSD) but failed to alter potentiation at later time points.

References

    1. Ackermann M, Matus A. Activity-induced targeting of profilin and stabilization of dendritic spine morphology. Nat Neurosci. 2003;6:1194–1200. - PubMed
    1. Aicardi G, Argilli E, Cappello S, Santi S, Riccio M, Thoenen H, Canossa M. Induction of long-term potentiation and depression is reflected by corresponding changes in secretion of endogenous brain-derived neurotrophic factor. Proc Natl Acad Sci USA. 2004;101:15788–15792. - PMC - PubMed
    1. Allen KM, Gleeson JG, Bagrodia S, Partington MW, MacMillan JC, Cerione RA, Mulley JC, Walsh CA. PAK3 mutation in nonsyndromic X-linked mental retardation. Nat Genet. 1998;20:25–30. - PubMed
    1. Arai A, Larson J, Lynch G. Anoxia reveals a vulnerable period in the development of long-term potentiation. Brain Res. 1990;511:353–357. - PubMed
    1. Arai A, Black J, Lynch G. Origins of the variations in long-term potentiation between synapses in the basal versus apical dendrites of hippocampal neurons. Hippocampus. 1994;4:1–9. - PubMed

Publication types

Substances

LinkOut - more resources