

In vitro expression levels of cell-cycle checkpoint proteins are associated with cellular DNA repair capacity in peripheral blood lymphocytes: a multivariate analysis
- PMID: 17362036
- PMCID: PMC2579792
- DOI: 10.1021/pr060655k
In vitro expression levels of cell-cycle checkpoint proteins are associated with cellular DNA repair capacity in peripheral blood lymphocytes: a multivariate analysis
Abstract
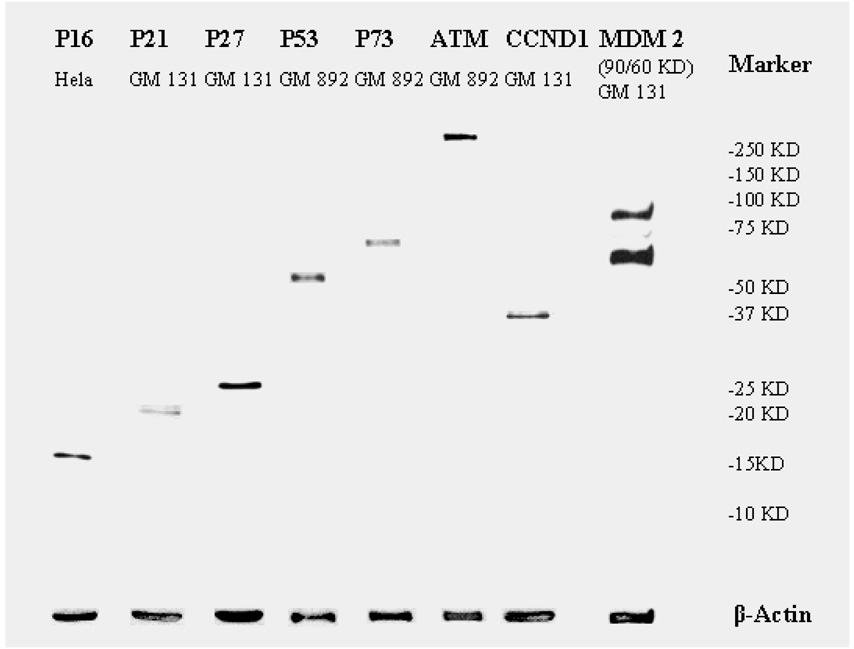
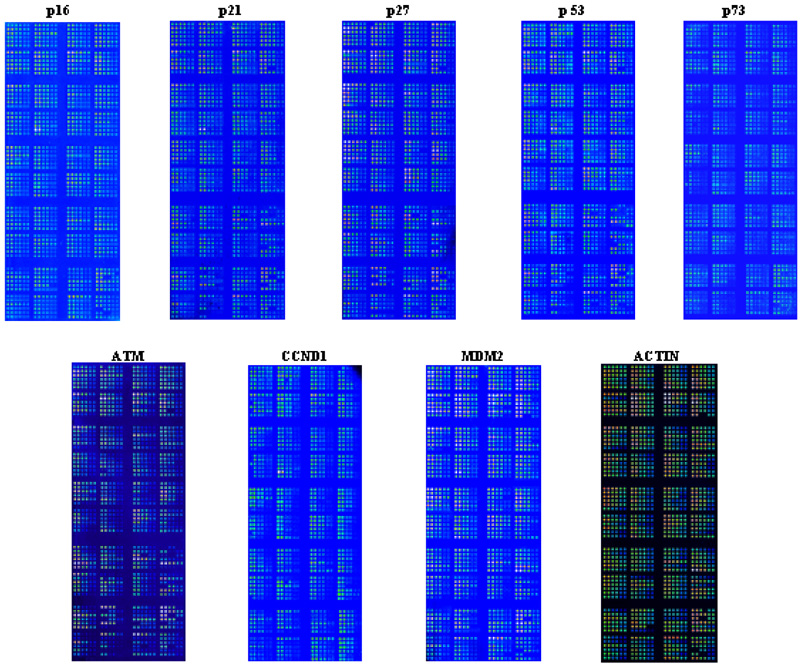
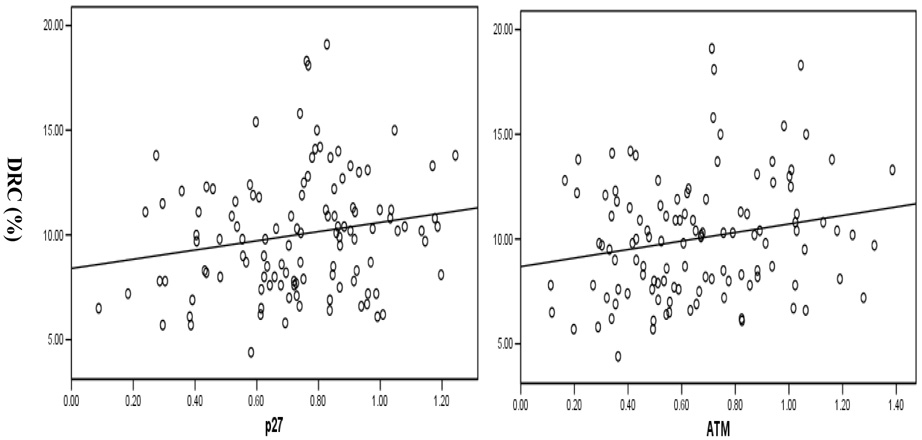
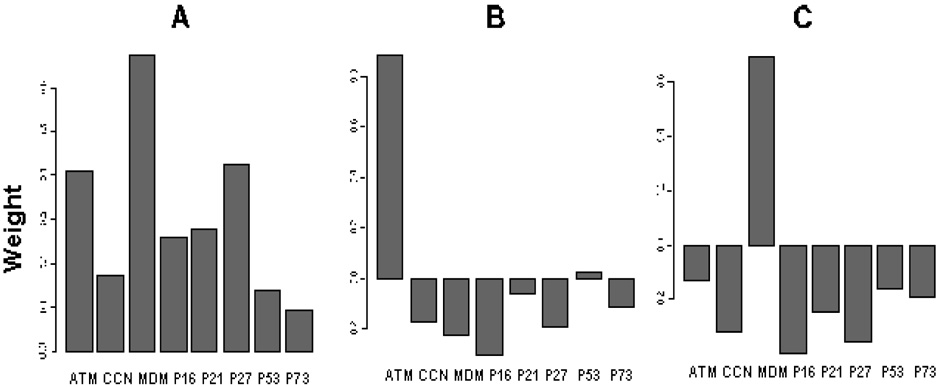
DNA repair should occur after cells sense DNA damage signals and undergo cell-cycle arrest to provide sufficient time for DNA repair, and suboptimal DNA repair capacity (DRC) in peripheral lymphocytes has been suggested as a cancer susceptibility marker. Numerous studies showed a functional link between DNA damage sensing, cell-cycle checkpoint, and DNA repair. We hypothesized that in vitro cell-cycle checkpoint-related protein expression levels in stimulated lymphocytes predict DRC levels. To test this hypothesis, we performed the host-cell reactivation assay for DRC by transfecting stimulated peripheral blood lymphocytes from 120 normal donors with transient expression plasmids damaged by benzo[a]pyrene diol epoxide (BPDE). The same cells were assessed for protein expression induction of eight cell-cycle checkpoint-related genes using the reverse-phase protein lysate microarray assay. In multivariate linear regression analysis adjusting for age, sex, blastogenic rate, and sample storage duration, the association between DRC and expression levels of cell-cycle checkpoint-related proteins induced by BPDE-adducts was statistically significant for p27, CCND1, ATM, and MDM2 (P = 0.00, 0.03, 0.03, and 0.03, respectively), borderline for p73 and p21 (P = 0.07 and 0.09, respectively), but not for p53 and p16 (P = 0.13 and 0.18, respectively). Because the relative expression levels of all these eight proteins were highly correlated, we further performed the principal component analysis and identified ATM as the most important predictor of DRC, followed by MDM2 and p27. Our results provide population-based in vitro evidence demonstrating that cell-cycle checkpoint-related proteins play essential roles in regulating DNA repair, at least in unaffected human peripheral blood lymphocytes. Further studies are warranted to investigate the role of interindividual variation in the expression levels of these proteins in cancer susceptibility.
Figures
Similar articles
-
A modified host-cell reactivation assay to measure repair of alkylating DNA damage for assessing risk of lung adenocarcinoma.Carcinogenesis. 2007 Jul;28(7):1430-6. doi: 10.1093/carcin/bgm029. Epub 2007 Mar 6. Carcinogenesis. 2007. PMID: 17341660
-
Reduced DNA repair of benzo[a]pyrene diol epoxide-induced adducts and common XPD polymorphisms in breast cancer patients.Carcinogenesis. 2004 Sep;25(9):1695-700. doi: 10.1093/carcin/bgh167. Epub 2004 Apr 16. Carcinogenesis. 2004. PMID: 15090466
-
Genetic polymorphisms in 19q13.3 genes associated with alteration of repair capacity to BPDE-DNA adducts in primary cultured lymphocytes.Mutat Res Genet Toxicol Environ Mutagen. 2016 Dec;812:39-47. doi: 10.1016/j.mrgentox.2016.10.004. Epub 2016 Oct 29. Mutat Res Genet Toxicol Environ Mutagen. 2016. PMID: 27908386
-
DNA repair phenotype and cancer susceptibility--a mini review.Int J Cancer. 2009 Mar 1;124(5):999-1007. doi: 10.1002/ijc.24126. Int J Cancer. 2009. PMID: 19065660 Free PMC article. Review.
-
Role of cell cycle in mediating sensitivity to radiotherapy.Int J Radiat Oncol Biol Phys. 2004 Jul 15;59(4):928-42. doi: 10.1016/j.ijrobp.2004.03.005. Int J Radiat Oncol Biol Phys. 2004. PMID: 15234026 Review.
Cited by
-
Proteomic profiling of lymphocytes in autoimmunity, inflammation and cancer.J Transl Med. 2014 Jan 7;12:6. doi: 10.1186/1479-5876-12-6. J Transl Med. 2014. PMID: 24397796 Free PMC article. Review.
-
Serial dilution curve: a new method for analysis of reverse phase protein array data.Bioinformatics. 2009 Mar 1;25(5):650-4. doi: 10.1093/bioinformatics/btn663. Epub 2009 Jan 28. Bioinformatics. 2009. PMID: 19176552 Free PMC article.
-
Development of reverse phase protein microarrays for the validation of clusterin, a mid-abundant blood biomarker.Proteome Sci. 2009 Apr 6;7:15. doi: 10.1186/1477-5956-7-15. Proteome Sci. 2009. PMID: 19348683 Free PMC article.
-
The AHR represses nucleotide excision repair and apoptosis and contributes to UV-induced skin carcinogenesis.Cell Death Differ. 2018 Nov;25(10):1823-1836. doi: 10.1038/s41418-018-0160-1. Epub 2018 Jul 16. Cell Death Differ. 2018. PMID: 30013037 Free PMC article.
-
Applications of protein microarrays for biomarker discovery.Proteomics Clin Appl. 2008 Oct;2(10-11):1444-59. doi: 10.1002/prca.200800032. Epub 2008 Sep 10. Proteomics Clin Appl. 2008. PMID: 21136793 Free PMC article.
References
-
- Garner RC. The role of DNA adducts in chemical carcinogenesis. Mutat Res. 1998;402(1–2):67–75. - PubMed
-
- Povey AC. DNA adducts: endogenous and induced. Toxicol Pathol. 2000;28(3):405–414. - PubMed
-
- Hoeijmakers JH. Genome maintenance mechanisms for preventing cancer. Nature. 2001;411(6835):366–374. - PubMed
-
- Evan GI, Vousden KH. Proliferation, cell cycle and apoptosis in cancer. Nature. 2001;411(6835):342–348. - PubMed
-
- Pero RW, Bryngelsson C, Mitelman F, Kornfalt R, Thulin T, Norden A. Interindividual variation in the responses of cultured human lymphocytes to exposure from DNA damaging chemical agents: interindividual variation to carcinogen exposure. Mutat Res. 1978;53(3):327–341. - PubMed
Publication types
MeSH terms
Substances
Grants and funding
LinkOut - more resources
Full Text Sources
Research Materials
Miscellaneous
