

Thermography and thermoregulation of the face
- PMID: 17362518
- PMCID: PMC1831767
- DOI: 10.1186/1746-160X-3-17
Thermography and thermoregulation of the face
Abstract
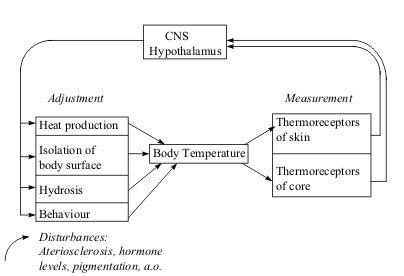
Background: Although clinical diagnosis of thermoregulation is gaining in importance there is no consistent evidence on the value of thermography of the facial region. In particular there are no reference values established with standardised methods.
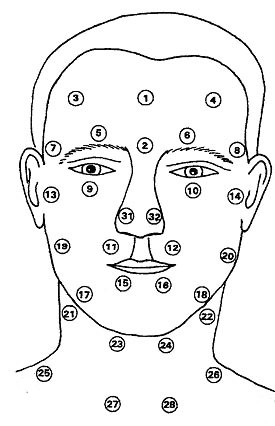
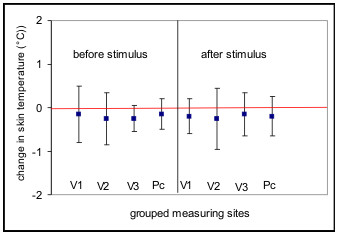
Methods: Skin temperatures were measured in the facial area at 32 fixed measuring sites in 26 health subjects (7-72 years) with the aid of a contact thermograph (Eidatherm). A total of 6 measurements were performed separately for the two sides of the face at intervals of equal lengths (4 hours) over a period of 24 hours. Thermoregulation was triggered by application of a cold stimulus in the region of the ipsilateral ear lobe.
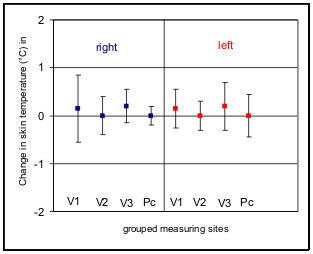
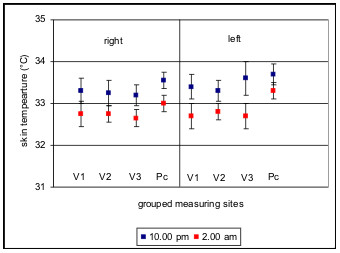
Results: Comparison of the sides revealed significant asymmetry of face temperature. The left side of the face showed a temperature that was on the average 0.1 degrees C lower than on the right. No increase in temperature was found following application of the cold stimulus. However, a significant circadian rhythm with mean temperature differences of 0.7 degrees C was observed.
Conclusion: The results obtained should be seen as an initial basis for compiling an exact thermoprofile of the surface temperature of the facial region that takes into account the circadian rhythm, thus closing gaps in studies on physiological changes in the temperature of the skin of the face.
Figures
Similar articles
-
Axillary and thoracic skin temperatures poorly comparable to core body temperature circadian rhythm: results from 2 adult populations.Biol Res Nurs. 2004 Jan;5(3):187-94. doi: 10.1177/1099800403260620. Biol Res Nurs. 2004. PMID: 14737919
-
Electronic facial thermography: an analysis of asymptomatic adult subjects.J Orofac Pain. 1995 Summer;9(3):255-65. J Orofac Pain. 1995. PMID: 8995925
-
[Thermoregulation under simulated weightlessness].Space Med Med Eng (Beijing). 1997 Jun;10(3):210-3. Space Med Med Eng (Beijing). 1997. PMID: 11540574 Chinese.
-
Liquid crystal contact thermography and its role in evaluating sensory disorders of primary neurological origin as revealed by intraneural microstimulation: a review.J La State Med Soc. 1991 Dec;143(12):20-6. J La State Med Soc. 1991. PMID: 1779189 Review.
-
Thermology and facial telethermography: Part II. Current and future clinical applications in dentistry.Dentomaxillofac Radiol. 1998 Mar;27(2):68-74. doi: 10.1038/sj/dmfr/4600324. Dentomaxillofac Radiol. 1998. PMID: 9656869 Review.
Cited by
-
Assessment of techniques of massage and pumping in the treatment of breast engorgement by thermography.Rev Lat Am Enfermagem. 2014 Mar-Apr;22(2):277-85. doi: 10.1590/0104-1169.3238.2413. Rev Lat Am Enfermagem. 2014. PMID: 26107836 Free PMC article. Clinical Trial.
-
Biopsychosocial Assessment of Pain with Thermal Imaging of Emotional Facial Expression in Breast Cancer Survivors.Medicines (Basel). 2018 Mar 30;5(2):30. doi: 10.3390/medicines5020030. Medicines (Basel). 2018. PMID: 29601485 Free PMC article.
-
Diagnostic accuracy of infrared thermal imaging for detecting COVID-19 infection in minimally symptomatic patients.Eur J Clin Invest. 2021 Mar;51(3):e13474. doi: 10.1111/eci.13474. Epub 2020 Dec 28. Eur J Clin Invest. 2021. PMID: 33336385 Free PMC article.
-
Thermography Sensor to Assess Motor and Sensitive Neuromuscular Sequels of Brain Damage.Sensors (Basel). 2024 Mar 7;24(6):1723. doi: 10.3390/s24061723. Sensors (Basel). 2024. PMID: 38543986 Free PMC article.
-
Thermal face recognition under different conditions.BMC Bioinformatics. 2021 Nov 8;22(Suppl 5):313. doi: 10.1186/s12859-021-04228-y. BMC Bioinformatics. 2021. PMID: 34749639 Free PMC article.
References
-
- Schwamm E. Therapie und Herddiagnostik. ZWR. 1975;84:486–488. - PubMed
-
- Laforie P, Laurent P, Hubin M, Gouault J, Samson M, Mihout B, Menard JF. Cutaneous thermography with thermoregulated probecontrolled microcomputer. Prog Clin Biol Res. 1982;107:431–438. - PubMed
-
- Qiu M, Liu W, Liu G, Wen J, Liu G, Chang S. Thermoregulation under simulated weightlessness. Space Med Med Eng. 1997;12:210–213. - PubMed
MeSH terms
LinkOut - more resources
Full Text Sources
