

Vital imaging of H9c2 myoblasts exposed to tert-butylhydroperoxide--characterization of morphological features of cell death
- PMID: 17362523
- PMCID: PMC1831770
- DOI: 10.1186/1471-2121-8-11
Vital imaging of H9c2 myoblasts exposed to tert-butylhydroperoxide--characterization of morphological features of cell death
Abstract
Background: When exposed to oxidative conditions, cells suffer not only biochemical alterations, but also morphologic changes. Oxidative stress is a condition induced by some pro-oxidant compounds, such as by tert-butylhydroperoxide (tBHP) and can also be induced in vivo by ischemia/reperfusion conditions, which is very common in cardiac tissue. The cell line H9c2 has been used as an in vitro cellular model for both skeletal and cardiac muscle. Understanding how these cells respond to oxidative agents may furnish novel insights into how cardiac and skeletal tissues respond to oxidative stress conditions. The objective of this work was to characterize, through vital imaging, morphological alterations and the appearance of apoptotic hallmarks, with a special focus on mitochondrial changes, upon exposure of H9c2 cells to tBHP.
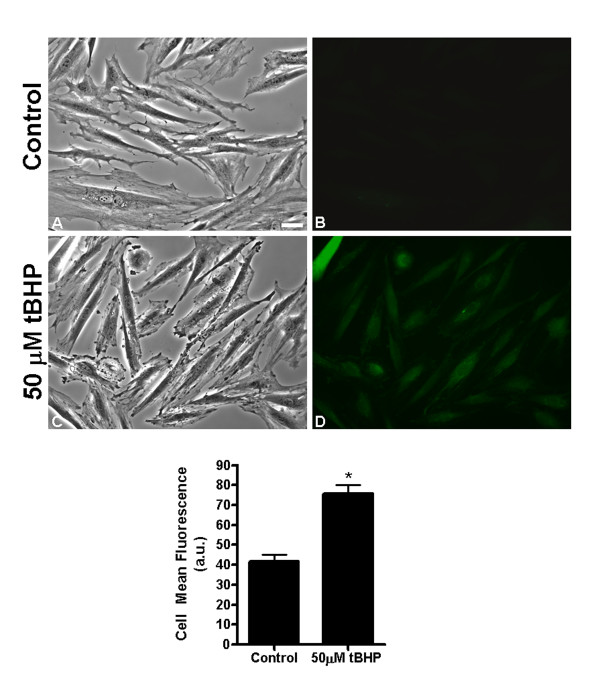
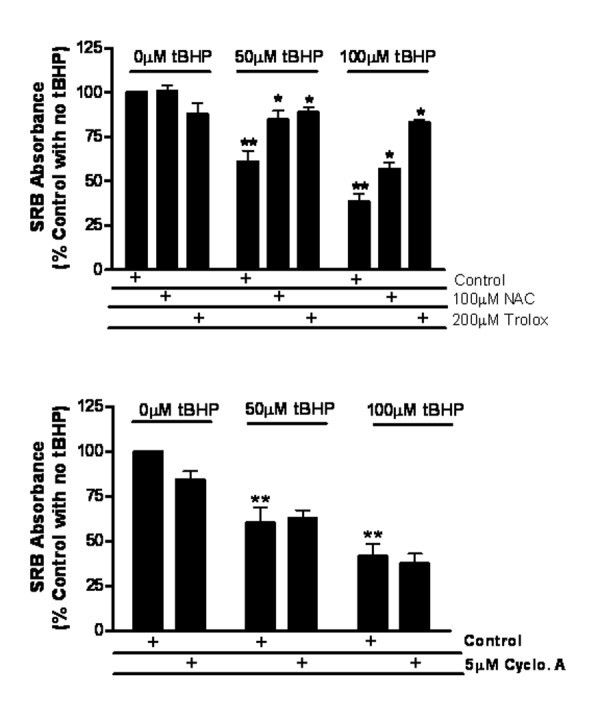
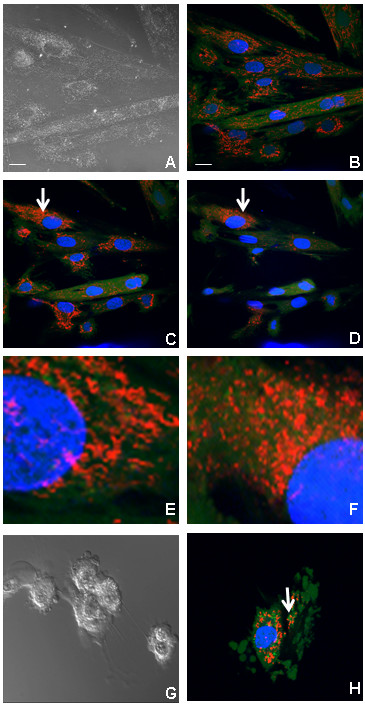
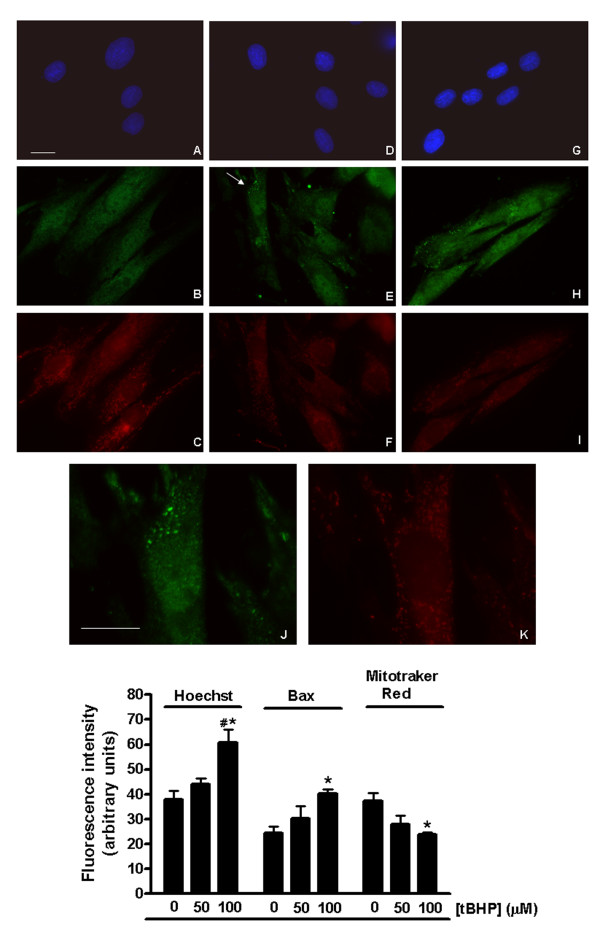
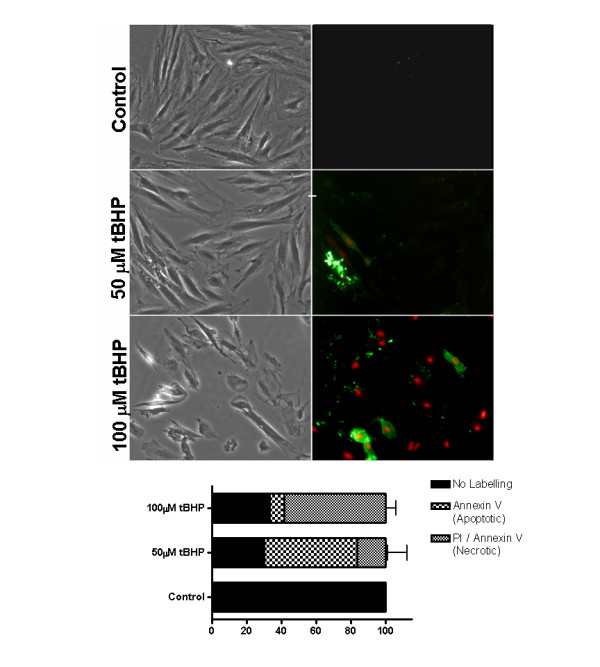
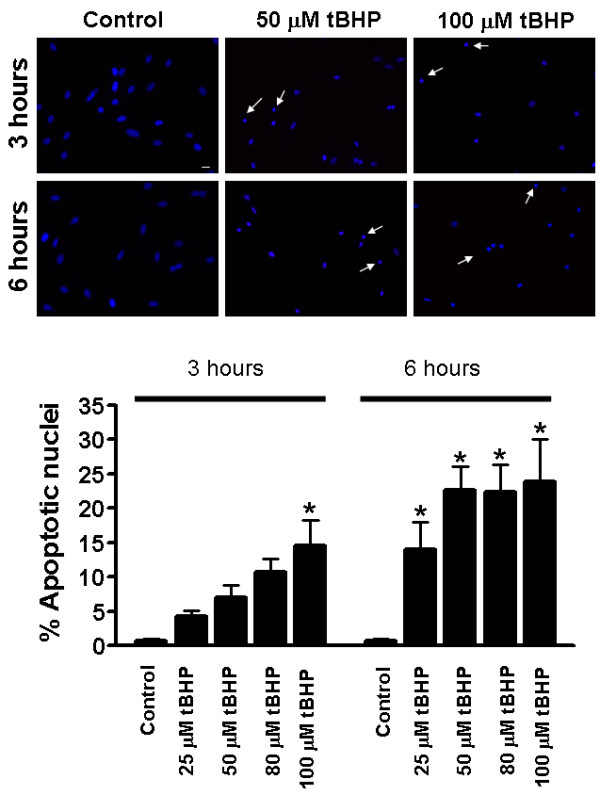
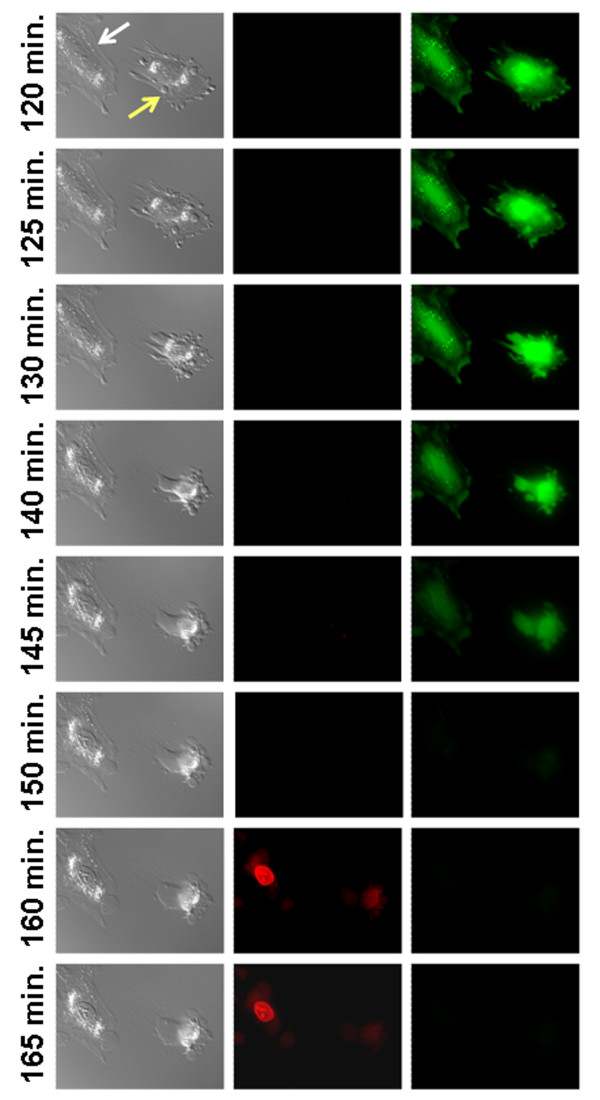
Results: When exposed to tBHP, an increase in intracellular oxidative stress was detected in H9c2 cells by epifluorescence microscopy, which was accompanied by an increase in cell death that was prevented by the antioxidants Trolox and N-acetylcysteine. Several morphological alterations characteristic of apoptosis were noted, including changes in nuclear morphology, translocation of phosphatidylserine to the outer leaflet of the cell membrane, and cell blebbing. An increase in the exposure period or in tBHP concentration resulted in a clear loss of membrane integrity, which is characteristic of necrosis. Changes in mitochondrial morphology, consisting of a transition from long filaments to small and round fragments, were also detected in H9c2 cells after treatment with tBHP. Bax aggregates near mitochondrial networks were formed after short periods of incubation.
Conclusion: Vital imaging of alterations in cell morphology is a useful method to characterize cellular responses to oxidative stress. In the present work, we report two distinct patterns of morphological alterations in H9c2 cells exposed to tBHP, a pro-oxidant agent frequently used as model to induce oxidative stress. In particular, dynamic changes in mitochondrial networks could be visualized, which appear to be centrally involved in how these cells respond to oxidative stress. The data also indicate that the cause of H9c2 cell death following tBHP exposure is increased intracellular oxidative stress.
Figures
Similar articles
-
Nitrogen compounds prevent h9c2 myoblast oxidative stress-induced mitochondrial dysfunction and cell death.Cardiovasc Toxicol. 2010 Mar;10(1):51-65. doi: 10.1007/s12012-010-9062-2. Cardiovasc Toxicol. 2010. PMID: 20119745
-
Apoptotic death in erythrocytes of lamprey Lampetra fluviatilis induced by ionomycin and tert-butyl hydroperoxide.Comp Biochem Physiol C Toxicol Pharmacol. 2017 Apr;194:48-60. doi: 10.1016/j.cbpc.2017.01.009. Epub 2017 Feb 2. Comp Biochem Physiol C Toxicol Pharmacol. 2017. PMID: 28163253
-
Knockout of VDAC1 in H9c2 Cells Promotes Oxidative Stress-Induced Cell Apoptosis through Decreased Mitochondrial Hexokinase II Binding and Enhanced Glycolytic Stress.Cell Physiol Biochem. 2020 Sep 9;54(5):853-874. doi: 10.33594/000000274. Cell Physiol Biochem. 2020. PMID: 32901466 Free PMC article.
-
2,3-Butanedione monoxime does not protect cardiomyocytes under oxidative stress.Cell Biochem Funct. 2006 Sep-Oct;24(5):413-8. doi: 10.1002/cbf.1277. Cell Biochem Funct. 2006. PMID: 16142696
-
Morphological alterations induced by doxorubicin on H9c2 myoblasts: nuclear, mitochondrial, and cytoskeletal targets.Cell Biol Toxicol. 2009 Jun;25(3):227-43. doi: 10.1007/s10565-008-9070-1. Epub 2008 Apr 3. Cell Biol Toxicol. 2009. PMID: 18386138
Cited by
-
Sulodexide attenuates endoplasmic reticulum stress induced by myocardial ischaemia/reperfusion by activating the PI3K/Akt pathway.J Cell Mol Med. 2019 Aug;23(8):5063-5075. doi: 10.1111/jcmm.14367. Epub 2019 May 23. J Cell Mol Med. 2019. PMID: 31120192 Free PMC article.
-
The Isopeptidase Inhibitor G5 Triggers a Caspase-independent Necrotic Death in Cells Resistant to Apoptosis: A COMPARATIVE STUDY WITH THE PROTEASOME INHIBITOR BORTEZOMIB.J Biol Chem. 2009 Mar 27;284(13):8369-81. doi: 10.1074/jbc.M806113200. Epub 2009 Jan 12. J Biol Chem. 2009. PMID: 19139105 Free PMC article.
-
Esculetin Neutralises Cytotoxicity of t-BHP but Not of H2O2 on Human Leukaemia NB4 Cells.Biomed Res Int. 2017;2017:9491045. doi: 10.1155/2017/9491045. Epub 2017 Mar 7. Biomed Res Int. 2017. PMID: 28367450 Free PMC article.
-
Stem cell transplantation in an in vitro simulated ischemia/reperfusion model.J Vis Exp. 2011 Nov 5;(57):e3575. doi: 10.3791/3575. J Vis Exp. 2011. PMID: 22083407 Free PMC article.
-
A tipping point in dihydroxyacetone exposure: mitochondrial stress and metabolic reprogramming alter survival in rat cardiomyocytes H9c2 cells.Chem Biol Interact. 2024 May 1;394:110991. doi: 10.1016/j.cbi.2024.110991. Epub 2024 Apr 4. Chem Biol Interact. 2024. PMID: 38582340 Free PMC article.
References
-
- Hescheler J, Meyer R, Plant S, Krautwurst D, Rosenthal W, Schultz G. Morphological, biochemical, and electrophysiological characterization of a clonal cell (H9c2) line from rat heart. Circ Res. 1991;69:1476–1486. - PubMed
-
- Wang W, Watanabe M, Nakamura T, Kudo Y, Ochi R. Properties and expression of Ca2+-activated K+ channels in H9c2 cells derived from rat ventricle. Am J Physiol. 1999;276:H1559–1566. - PubMed
Publication types
MeSH terms
Substances
Grants and funding
LinkOut - more resources
Full Text Sources
Other Literature Sources
Research Materials
