. 2007 Jun 1;581(Pt 2):741-55.
doi: 10.1113/jphysiol.2007.130161. Epub 2007 Mar 15.

Charge at the lidocaine binding site residue Phe-1759 affects permeation in human cardiac voltage-gated sodium channels

Affiliations

Charge at the lidocaine binding site residue Phe-1759 affects permeation in human cardiac voltage-gated sodium channels

Megan M McNulty et al. J Physiol. .

Abstract

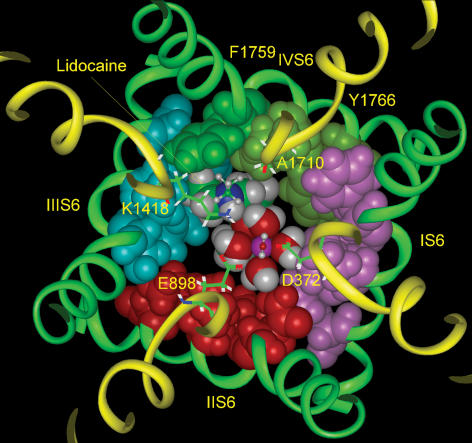
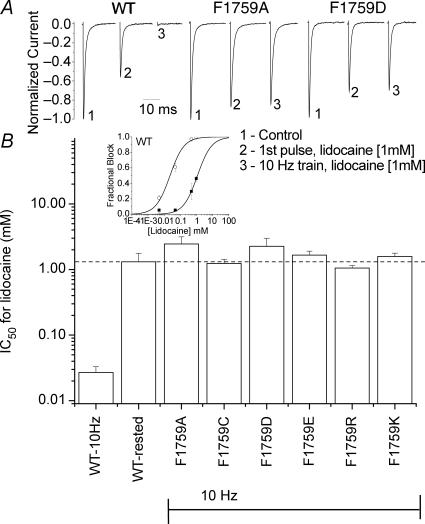
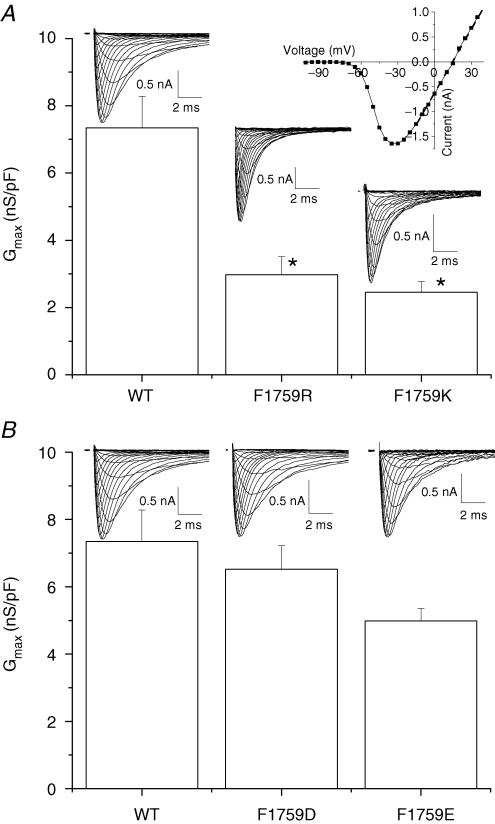
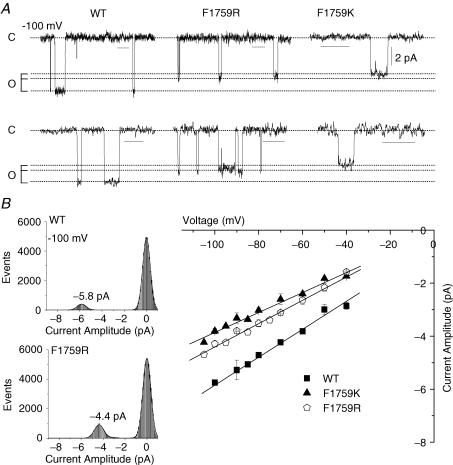
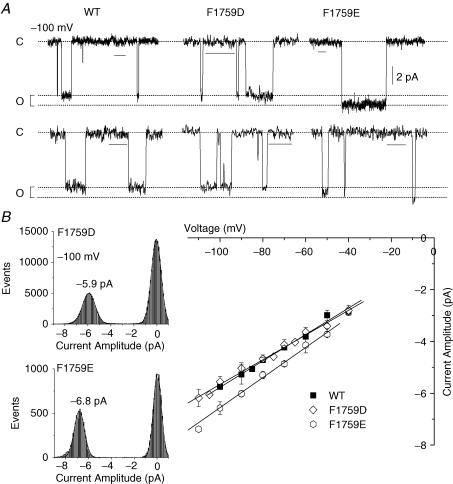
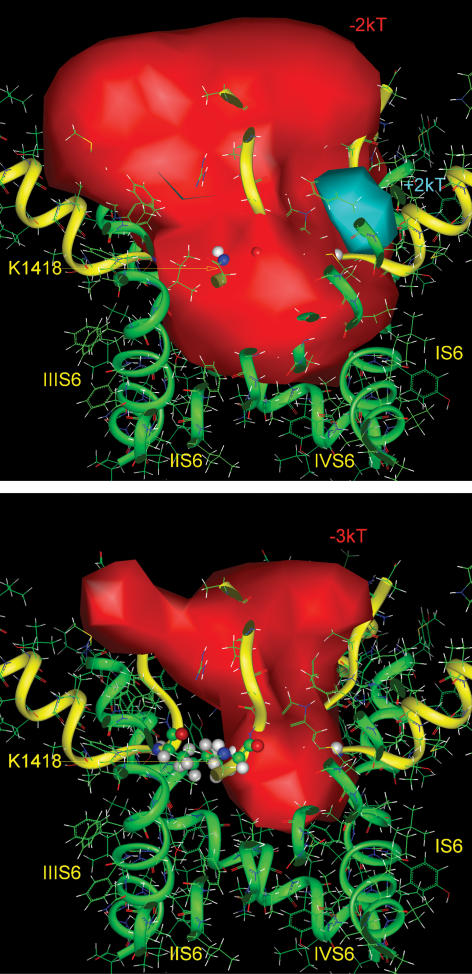
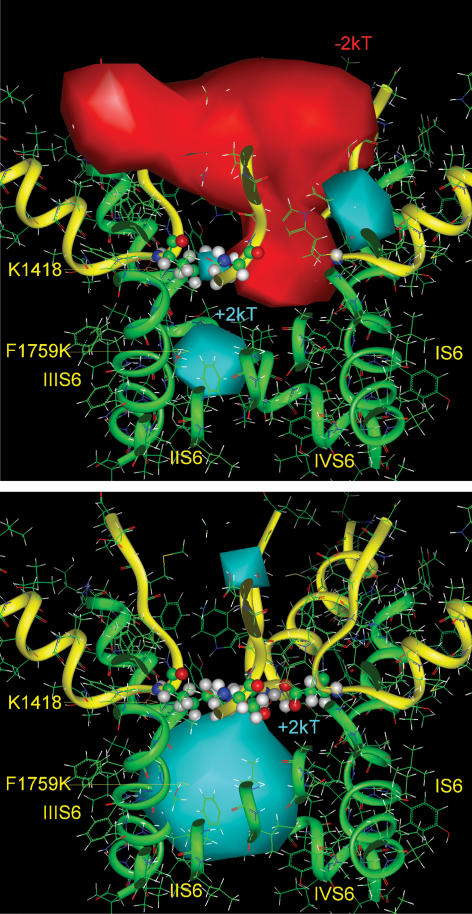
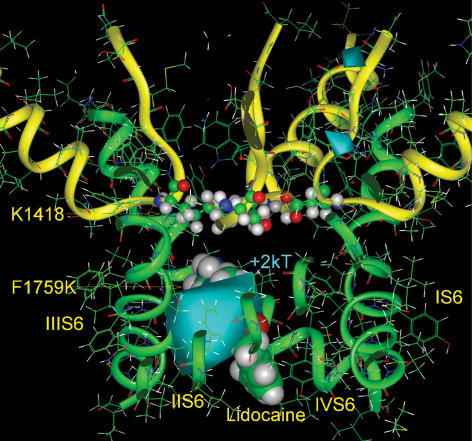
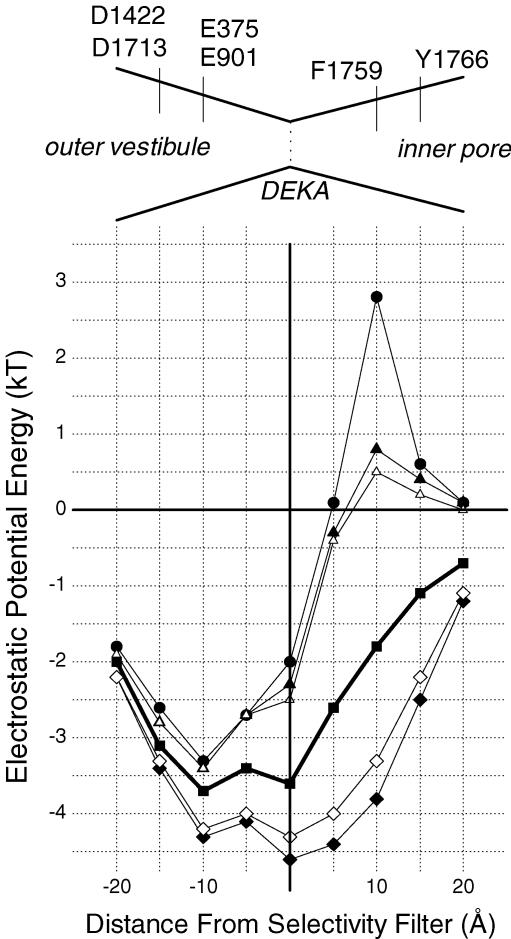
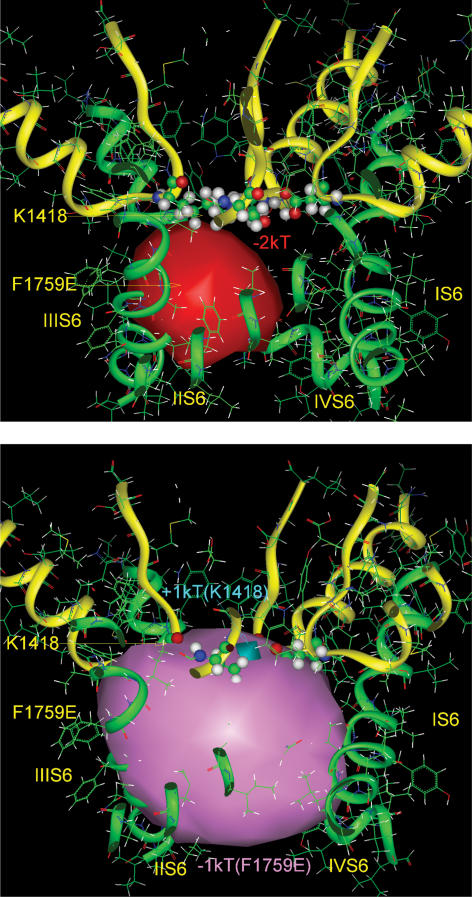
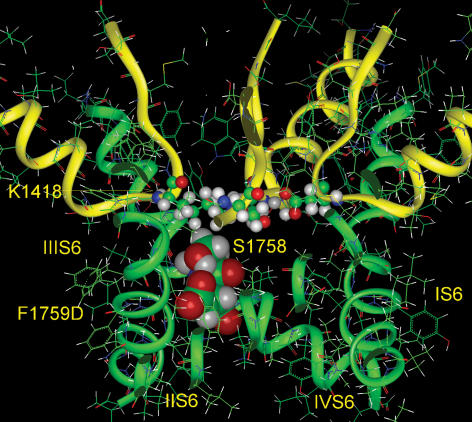
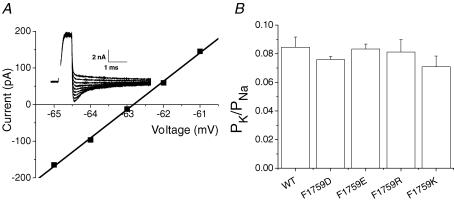
Our homology molecular model of the open/inactivated state of the Na(+) channel pore predicts, based on extensive mutagenesis data, that the local anaesthetic lidocaine docks eccentrically below the selectivity filter, such that physical occlusion is incomplete. Electrostatic field calculations suggest that the drug's positively charged amine produces an electrostatic barrier to permeation. To test the effect of charge at this pore level on permeation in hNa(V)1.5 we replaced Phe-1759 of domain IVS6, the putative binding site for lidocaine's alkylamino end, with positively and negatively charged residues as well as the neutral cysteine and alanine. These mutations eliminated use-dependent lidocaine block with no effect on tonic/rested state block. Mutant whole cell currents were kinetically similar to wild type (WT). Single channel conductance (gamma) was reduced from WT in both F1759K (by 38%) and F1759R (by 18%). The negatively charged mutant F1759E increased gamma by 14%, as expected if the charge effect were electrostatic, although F1759D was like WT. None of the charged mutations affected Na(+)/K(+) selectivity. Calculation of difference electrostatic fields in the pore model predicted that lidocaine produced the largest positive electrostatic barrier, followed by lysine and arginine, respectively. Negatively charged glutamate and aspartate both lowered the barrier, with glutamate being more effective. Experimental data were in rank order agreement with the predicted changes in the energy profile. These results demonstrate that permeation rate is sensitive to the inner pore electrostatic field, and they are consistent with creation of an electrostatic barrier to ion permeation by lidocaine's charge.


Figures

Figure 1
Figure 1. Lidocaine docked in a model of the Na+ channel pore
Model coordinates described in Lipkind & Fozzard (2005). Lidocaine docks eccentrically in the open pore of the Na+ channel beneath the DEKA selectivity filter (shown as sticks for clarity and numbered). Lidocaine and the side chains of S6 α-helices facing the inner pore are shown by space-filled images. Domains I, II, III and IV are distinguished by pink, red, blue and green, respectively. The figure also shows a possible location of a hydrated Na+ ion (with octahedral coordination) in its pathway inside the pore between the alkylammonium group of lidocaine and the α-helix of domain II S6. The upper molecule of water and the upper alkyl chain of lidocaine are shown by small balls and sticks for clarity.
Figure 2
Figure 2. Lidocaine block of Phe-1759 mutants
A, representative normalized current traces of WT, F1759A and F1759D channels in the absence and presence of lidocaine. Currents at −10 mV (from Vholding of −140 mV) were first recorded in the absence of lidocaine (1). Lidocaine (1 mm) was then washed on for 3–5 min while cells were held at −140 mV (currents are shown as the fraction of peak current in absence of lidocaine). The decrease in currents elicited with the 1st pulse following the wash (2) reflects block of closed channels by lidocaine. Use-dependent block was assayed as the additional reduction in current in a 10 Hz train (3). To account for the small reduction in current evident in this protocol from the accumulation of inactivated channels in the absence of drug (average for each mutant was < 15%), currents were normalized to the peak steady state current in the 10 Hz train in the absence of drug. WT exhibited large use dependent block; which was entirely absent in the Phe-1759 mutants. B, inset, dose–response curves for WT representing rested state block (▪) and use-dependent block (○) as described in A (n = 3–8 at each concentration). WT channels exhibited a ∼50-fold increase in the apparent affinity when cells were repetitively depolarized. For mutant channels IC50 values after 10 Hz trains were determined by estimating the IC50 from fractional block over the concentration range of 0.1–10 mm lidocaine (IC50= ((1 – fraction blocked) ×[lidocaine]))/fraction blocked) with each cell contributing one estimate. For none of the mutant channels was block significantly different from that of rested state (dashed line). n values: WT, 10 Hz, 18; WT, rested/1st pulse,13; F1759A, 10; F1759C, 4; F1759D, 9; F1759E, 14; F1759R, 5; F1759K, 9.
Figure 3
Figure 3. Replacement of Phe-1759 with lysine (K) or arginine (R) reduces macroscopic conductance
A, currents were recorded using whole cell voltage clamp from a holding potential of −140 mV, stepping from −130 mV to +50 mV every 1–2 s. Maximum macroscopic conductances (Gmax) of individual cells were determined from the slope of the linear region of the current–voltage (IV) relationships of individual cells and normalized to cell capacitance. Currents through F1759R and F1759K channels were recorded with the following Na+ gradient: 70 mm[Na+]o to 40 [Na+]i. WT currents were measured with 10 mm[Na+]o and 5 mm[Na+]i. All Gmax values were adjusted to the 70/40 Na+ condition. Population data demonstrate that substitution of Phe-1759 with the positively charged residues, lysine or arginine, significantly reduced macroscopic conductance (*P < 0.05). B, maximum macroscopic conductances (Gmax) of channels with replacement of Phe 1759 with aspartate (D) or glutamate (E). Currents through F1759D were recorded with 20 mm[Na+]o and 10 mm[Na+]i. F1759E currents were measured with 10 mm[Na+]o and 5 mm[Na+]i. and again Gmax values were adjusted to the 70/40 Na+ condition. Gmax values for F1759D and F1759E were not significantly different from WT.
Figure 4
Figure 4. Single channel conductance for WT, F1759K and F1759R
A, representative single channel currents from cell attached patches of WT, F1759K, and F1759R channels, recorded at −100 mV with 280 mm Na+ and 20 μm fenvalerate in the pipette. XY scale bars: all traces are displayed with the same Y scale bar (2 pA); the X scale bars represent 100 ms for the top traces and 50 ms for the bottom traces. B, left, amplitude histograms for selected segments of traces recorded at −100 mV. Marked, baseline corrected segments were analysed in Clampfit 8.2 (Molecular Devices, Sunnyvale, CA, USA) and amplitude histograms generated in Origin (OriginLab Corp, Northampton, MA, USA) were fitted with Gaussian distributions using a nonlinear least squares algorithm. Right, averaged amplitudes across patches (n = 4 patches for each channel type) ±s.e.m. are plotted as a function of voltage. Current amplitudes were measured by either directly measuring events in Clampfit 8.2 or through fitting amplitude histograms in Origin. To obtain single channel conductance values, current–voltage relationships from each patch were individually fitted with a linear function. Conductances were then averaged across patches (n = 4 patches for each channel) and are given ±s.e.m. as follows: WT, 49.5 ± 1.1 pS; F1759R, 40.6 ± 1.2 pS; F1759K, 30.5 ± 1.2 pS. Replacement of Phe with lysine and arginine reduced single channel conductance 38% and 18%, respectively.
Figure 5
Figure 5. Single channel conductance for WT, F1759D and F1759E
A, representative single channel currents from cell attached patches of WT, F1759D, and F1759E channels, recorded at −100 mV with 280 mm Na+ and 20 μm fenvalerate in the pipette. XY scale bars: all traces are displayed with the same Y scale bar (2 pA); the X scale bars represent 100 ms for top traces, 20 ms for bottom left traces, and 50 ms for the bottom middle (F1759D) and right (F1759E) traces. B, left, amplitude histograms for selected segments of traces recorded at −100 mV. Amplitude histograms, generated as described in Fig. 5, were fitted with Gaussian distributions using a nonlinear least squares algorithm. (Right) Averaged amplitudes across patches (n = 4 patches for each channel type) ±s.e.m. are plotted as a function of voltage. Current amplitudes were measured by either directly measuring events in Clampfit 8.2 or through fitting amplitude histograms in Origin. Current–voltage relationships from each patch were individually fitted with a linear function to determine γ. Conductances were then averaged across patches and are given ±s.e.m. as follows: WT, 49.5 ± 1.1 pS (n = 4 patches); F1759D, 46.2 ± 2.3 pS (n = 4 patches); and F1759E, 57.7 ± 1.2 pS (n = 3 patches). Replacement of phenylalanine with aspartate did not affect γ whereas replacement with glutamate increased γ 14%.
Figure 6
Figure 6. Electrostatic potentials in the pore of the modelled NaV1.5 channel at two energy levels
Top, the contour of the negative isopotential surface is shown at the level of −2 kT (red solid surface), which fills the volume of both the outer vestibule and the inner pore. Bottom, the contour of the deeper negative isopotential surface is shown at the level of −3 kT which fills the volume of the outer vestibule, through a portion of the selectivity filter. The positive charge of the side chain of lysine (Lys-1418) of the Na+ channel selectivity filter interferes with the negative potential within the proximal region, but the isopotential +3 kT is absent. The channel is shown by side view. The backbones of the pore and the outer vestibule are shown by green and yellow ribbons, respectively. Ball and stick representations are given for the four selectivity filter residues (DEKA motif) of the domains I–IV P loops.
Figure 7
Figure 7. Electrostatic potentials in the pore of the F1759K mutant
Top, the positive charge of the amino head of the side chain of Lys-1759 (presented here by equipotential +2 kT) sharply interrupts the negative electrostatic potential of the outer vestibule (−2 kT, red solid surface) at the level of the selectivity filter (here shown by stick and ball images), hindering Na+ permeation. The channel is shown in side view. The backbones of the pore and the outer vestibule are shown by green and yellow ribbons. Bottom, the difference positive electrostatic potential (+2 kT, blue solid surface) calculated by subtraction of the fields with the F1759K and WT channels, illustrates the field generated only by the side chain of Lys-1759.
Figure 8
Figure 8. The difference electrostatic potential between the Na+ channel, blocked by lidocaine, and the F1759K mutant (+2 kT, blue solid surface)
Lidocaine inside of the pore and the side chain of Lys-1759 are shown by space-filled images. The positive electrostatic field introduced by lidocaine is much stronger than that by substitution of Phe-1759 with lysine.
Figure 11
Figure 11. Electrostatic potential energy profiles for Na+ moving along the central axis of the pore for the WT channel (thick line, ▪), for the WT channel with lidocaine bound (•), and channel mutants F1759K (▴), F1759R (▵), F1759E (♦), and F1759D (◊)
Distances are expressed relative to the position of the selectivity filter (DEKA) with the extracellular space to the left (negative values) and the intracellular space to the right (positive values). Diagram above shows a schematic of the pore labelled with location of important amino acid residues.
Figure 9
Figure 9. Electrostatic potentials in the pore of the F1759E mutant
Top, the negative charge of the carboxylate group of the side chain Glu-1759 produced an additional negative electrostatic field inside of the inner pore of the Na+ channel, shown here by the difference negative electrostatic isopotential (−2 kT, red solid surface), calculated by subtraction of the fields with the F1759E and WT Na+ channels. Bottom, the negative electrostatic potential, generated by substitution of Phe-1759 by glutamate (−1 kT, pink solid surface) overcomes the weak positive electrostatic potential produced by Lys-1418 inside of the selectivity filter (+1 kT, blue solid surface) and enhances the negative electrostatic field of the outer vestibule of the Na+ channel.
Figure 10
Figure 10. The mutant F1759D
The carboxylate group of aspartate at 1759 forms a hydrogen bond with the side chain of neighbouring Ser-1758, screening its negative charge.
Figure 12
Figure 12. Mutations at Phe-1759 do not alter selectivity
Na+/K+ selectivity was determined by measuring reversal potentials under biionic conditions (140 mm[Na+]o: 140 mm[K+]i or the reverse gradient, 140 mm[K+]o: 140 mm[Na+]i). With Na+ in the bath and K+ in the pipette, reversal potentials were measured after depolarizing cells from +30 mV to potentials positive to +80 mV at 2 mV increments from a holding potential of −100 mV. With the reverse gradient (140 mm[K+]o: 140 mm[Na+]i), reversal potentials were measured from tail currents recorded during hyperpolarizations (−80 to −45 mV in 1 mV increments) after a brief depolarization (0.5–0.6 s) to −10 mV (A) Representative WT tail currents (inset) and the corresponding current–voltage relationship measured using the reverse gradient (140 mm[K+]o: 140 mm[Na+]i). Two to four data points on either side of the x axis where currents are small and well-controlled were linearly fit to determine the reversal potential. B, permeability ratios (PK/PNa) for Phe-1759 mutants. WT data collected using both gradients yielded the same ratios and were thus pooled. Reversal potentials of the mutant channels were collected under one gradient (140 mm[Na+]o: 140 mm[K+]i). There were no differences in the permeability ratios across Phe-1759 mutants (n values: WT, 12; F1759D, 3; F1759E, 5; F1759R, 3; F1759K, 5).

Comment in

Similar articles

Cited by

References

    1. Ahern CA, Eastwood A, Lester H, Dougherty D, Horn R. Investigating cation–pi interactions in the local anesthetic block of voltage gated sodium channels. Biophys J. 2006;22a abstract.
    1. Allen TW, Andersen OS, Roux B. On the importance of atomic fluctuations, protein flexibility, and solvent in ion permeation. J Gen Physiol. 2004;124:679–690. - PMC - PubMed
    1. Backx PH, Yue DT, Lawrence JH, Marban E, Tomaselli GF. Molecular localization of an ion-binding site within the pore of mammalian sodium channels. Science. 1992;257:248–251. - PubMed
    1. Benitah J, Balser JR, Marban E, Tomaselli GF. Proton inhibition of sodium channels: mechanism of gating shifts and reduced conductance. J Membr Biol. 1997;155:121–131. - PubMed
    1. Bichet D, Grabe M, Jan YN, Jan LY. Electrostatic interactions in the channel cavity as an important determinant of potassium channel selectivity. Proc Natl Acad Sci U S A. 2006;103:14355–14360. - PMC - PubMed

Publication types

MeSH terms

LinkOut - more resources