

Synaptic plasticity in myenteric neurons of the guinea-pig distal colon: presynaptic mechanisms of inflammation-induced synaptic facilitation
- PMID: 17363386
- PMCID: PMC2075198
- DOI: 10.1113/jphysiol.2007.128082
Synaptic plasticity in myenteric neurons of the guinea-pig distal colon: presynaptic mechanisms of inflammation-induced synaptic facilitation
Abstract
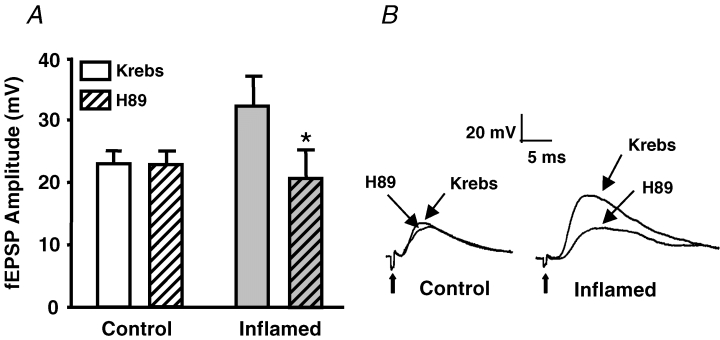
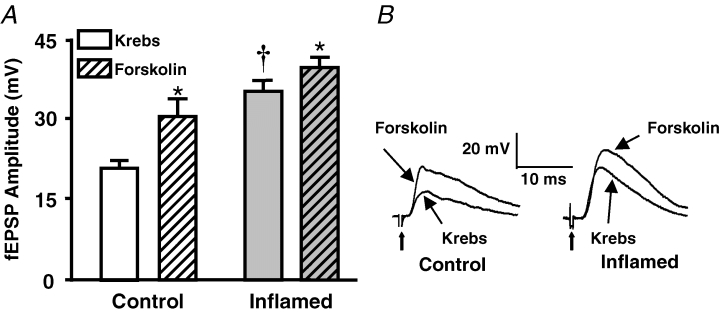
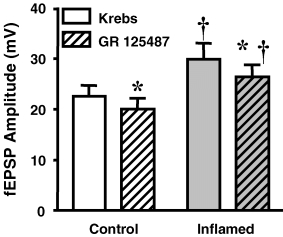
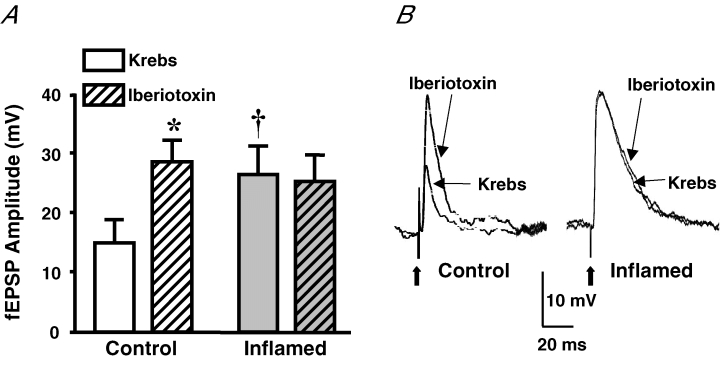
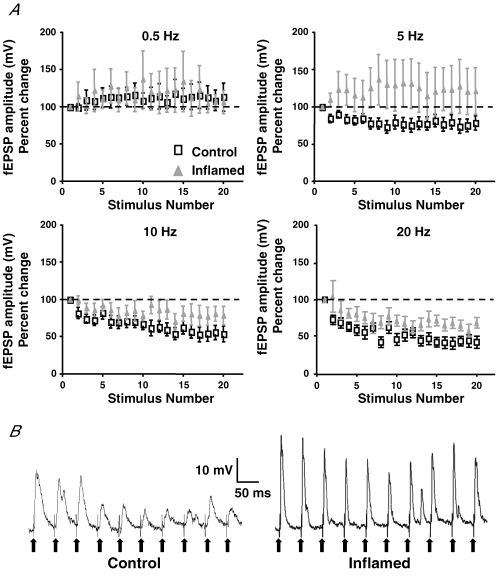
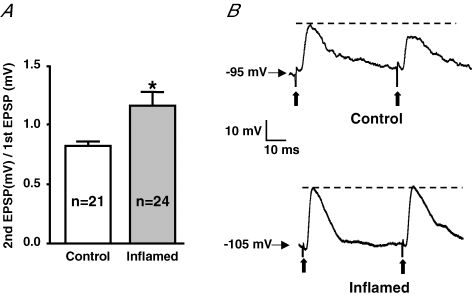
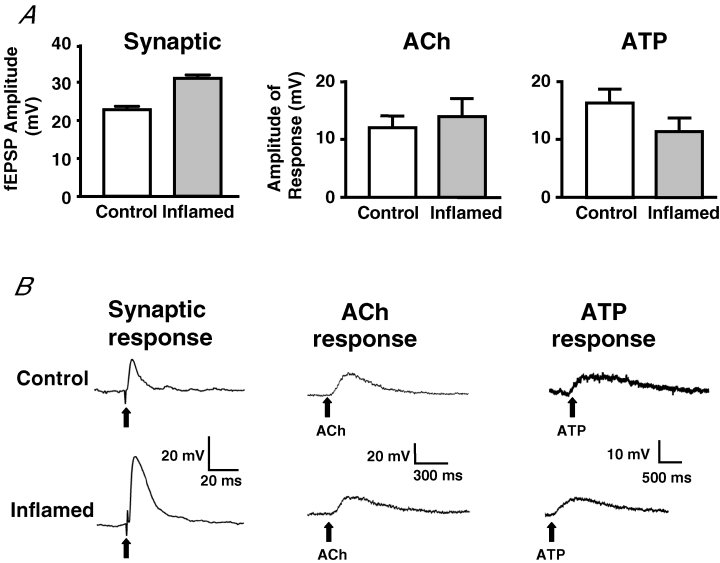
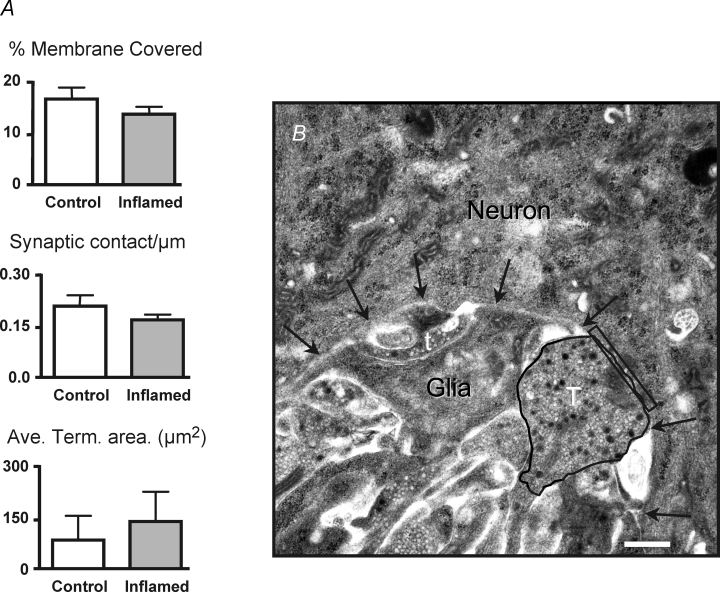
The purpose of this study was to investigate the pre- and postsynaptic mechanisms that contribute to synaptic facilitation in the myenteric plexus of the trinitrobenzene sulphonic acid-inflamed guinea-pig distal colon. Intracellular recordings of evoked fast excitatory postsynaptic potentials (fEPSPs) in myenteric S neurons were evaluated, and the density of synaptic terminals was morphometrically analysed by transmission electron microscopy. In inflamed tissue, fEPSPs were reduced to control levels by the protein kinase A (PKA) inhibitor, H89, but H89 did not affect the fEPSPs in control tissue. This PKA activation in inflamed tissue did not appear to involve 5-HT(4) receptors because the antagonist/inverse agonist, GR 125487, caused comparable decreases of fEPSPs in both tissues. Inhibition of BK channels with iberiotoxin did not alter the fEPSPs in inflamed tissue, but increased the fEPSPs in control tissue to the amplitude detected in inflamed tissue. During trains of stimuli, run-down of EPSPs was less extensive in inflamed tissue and there was a significant increase in the paired pulse ratio. Depolarizations in response to exogenous neurotransmitters were not altered in inflamed tissue. These inflammation-induced changes were not accompanied by alterations in the pharmacological profile of EPSPs, and no changes in synaptic density were detected by electron microscopy. Collectively, these data indicate that synaptic facilitation in the inflamed myenteric plexus involves a presynaptic increase in PKA activity, possibly involving an inhibition of BK channels, and an increase in the readily releasable pool of synaptic vesicles.
Figures
Similar articles
-
Slow synaptic transmission in myenteric AH neurons from the inflamed guinea pig ileum.Am J Physiol Gastrointest Liver Physiol. 2009 Sep;297(3):G582-93. doi: 10.1152/ajpgi.00026.2009. Epub 2009 Jun 25. Am J Physiol Gastrointest Liver Physiol. 2009. PMID: 19556360
-
Synaptic facilitation and enhanced neuronal excitability in the submucosal plexus during experimental colitis in guinea-pig.J Physiol. 2005 May 1;564(Pt 3):863-75. doi: 10.1113/jphysiol.2005.084285. Epub 2005 Mar 17. J Physiol. 2005. PMID: 15774518 Free PMC article.
-
Enhanced excitability of myenteric AH neurones in the inflamed guinea-pig distal colon.J Physiol. 2003 Mar 1;547(Pt 2):589-601. doi: 10.1113/jphysiol.2002.035147. Epub 2003 Jan 24. J Physiol. 2003. PMID: 12562910 Free PMC article.
-
Colitis-induced neuroplasticity disrupts motility in the inflamed and post-inflamed colon.J Clin Invest. 2015 Mar 2;125(3):949-55. doi: 10.1172/JCI76306. Epub 2015 Mar 2. J Clin Invest. 2015. PMID: 25729851 Free PMC article. Review.
-
Multiple mechanisms of fast excitatory synaptic transmission in the enteric nervous system.J Auton Nerv Syst. 2000 Jul 3;81(1-3):97-103. doi: 10.1016/s0165-1838(00)00130-2. J Auton Nerv Syst. 2000. PMID: 10869707 Review.
Cited by
-
The roles of purinergic signaling during gastrointestinal inflammation.Curr Opin Pharmacol. 2012 Dec;12(6):659-66. doi: 10.1016/j.coph.2012.09.011. Epub 2012 Oct 11. Curr Opin Pharmacol. 2012. PMID: 23063457 Free PMC article. Review.
-
The α isoform of cGMP-dependent protein kinase 1 (PKG1α) is expressed and functionally important in intrinsic primary afferent neurons of the guinea pig enteric nervous system.Neurogastroenterol Motil. 2021 Aug;33(8):e14100. doi: 10.1111/nmo.14100. Epub 2021 Mar 3. Neurogastroenterol Motil. 2021. PMID: 33655600 Free PMC article.
-
Methods to Study the Myenteric Plexus of Rat Small Intestine.Cell Mol Neurobiol. 2023 Jan;43(1):315-325. doi: 10.1007/s10571-021-01181-5. Epub 2021 Dec 21. Cell Mol Neurobiol. 2023. PMID: 34932174 Free PMC article.
-
Phenotypic changes of morphologically identified guinea-pig myenteric neurons following intestinal inflammation.J Physiol. 2007 Sep 1;583(Pt 2):593-609. doi: 10.1113/jphysiol.2007.135947. Epub 2007 Jul 5. J Physiol. 2007. PMID: 17615102 Free PMC article.
-
Alterations to enteric neural signaling underlie secretory abnormalities of the ileum in experimental colitis in the guinea pig.Am J Physiol Gastrointest Liver Physiol. 2009 Apr;296(4):G717-26. doi: 10.1152/ajpgi.90472.2008. Epub 2009 Feb 12. Am J Physiol Gastrointest Liver Physiol. 2009. PMID: 19221017 Free PMC article.
References
-
- Alkadhi KA, Alzoubi KH, Aleisa AM. Plasticity of synaptic transmission in autonomic ganglia. Prog Neurobiol. 2005;75:83–108. - PubMed
-
- Bertrand PP, Kunze WA, Bornstein JC, Furness JB, Smith ML. Analysis of the responses of myenteric neurons in the small intestine to chemical stimulation of the mucosa. Am J PhysiolGastrointest Liver Physiol. 1997;273:G422–G435. - PubMed
-
- Bockaert J, Claeysen S, Compan V, Dumuis A. 5-HT4 receptors. Curr Drug Targets CNS Neurol Disord. 2004;3:39–51. - PubMed
-
- Bornstein JC, Furness JB, Kunze WA. Electrophysiological characterization of myenteric neurons: how do classification schemes relate? J Auton Nerv Syst. 1994;48:1–15. - PubMed
Publication types
MeSH terms
Substances
Grants and funding
LinkOut - more resources
Full Text Sources