. 2007 Jun 1;581(Pt 2):467-78.
doi: 10.1113/jphysiol.2006.127365. Epub 2007 Mar 15.

Dynamics of the readily releasable pool during post-tetanic potentiation in the rat calyx of Held synapse

Affiliations

Dynamics of the readily releasable pool during post-tetanic potentiation in the rat calyx of Held synapse

Ron L P Habets et al. J Physiol. .

Abstract

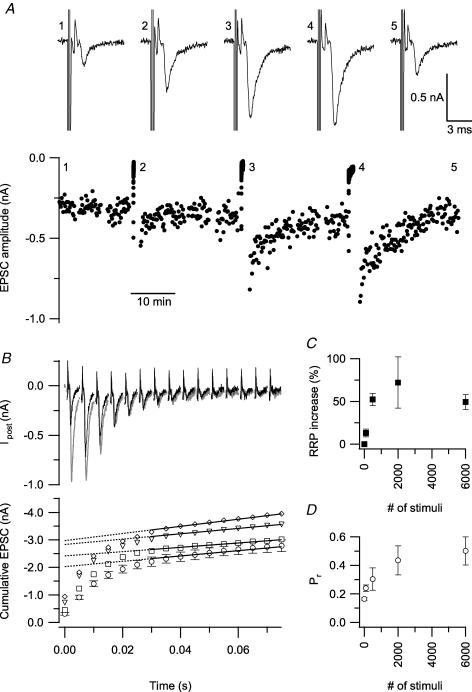
The size of the readily releasable pool (RRP) of vesicles was measured in control conditions and during post-tetanic potentiation (PTP) in a large glutamatergic terminal called the calyx of Held. We measured excitatory postsynaptic currents evoked by a high frequency train of action potentials in slices of 4-11-day-old rats. After a tetanus the cumulative release during such a train was enlarged by approximately 50%, indicating that the size of the RRP was increased. The amount of enhancement depended on the duration and frequency of the tetanus and on the age of the rat. After the tetanus, the size of the RRP decayed more slowly (t(1/2)=10 versus 3 min) back to control values than the release probability. This difference was mainly due to a very fast initial decay of the release probability, which had a time constant compatible with an augmentation phase (tau approximately 30 s). The overall decay of PTP at physiological temperature was not different from room temperature, but the increase in release probability (P(r)) was restricted to the first minute after the tetanus. Thereafter PTP was dominated by an increase in the size of the RRP. We conclude that due to the short lifetime of the increase in release probability, the contribution of the increase in RRP size during post-tetanic potentiation is more significant at physiological temperature.


Figures

Figure 1
Figure 1. Induction criteria for PTP at 100 Hz
Axons were stimulated in the midline and EPSCs were recorded in the presence of 2 mm kynurenic acid. The experiments were conducted at RT in slices of 9–10-day-old rats. A, EPSC amplitudes were measured at 0.1 Hz before and after a 100 Hz tetanus of 500, 2000 and 6000 stimuli. Top, example traces, numbers indicate corresponding time point in the bottom graph. B, 6 min before and 1 min after the tetanus the size of the RRP was probed with a short 200 Hz train (25 stimuli). Black traces in the top panel show the first 15 EPSCs in such a train under control conditions, while grey traces show the same, 1 min after a tetanus (6000 stimuli at 100 Hz). Stimulation artefacts were blanked, but prespikes are shown. In the bottom panel the EPSC amplitudes of the 200 Hz trains are plotted cumulatively. The amplitudes after a tetanus of 500 stimuli (□), 2000 (∇) and 6000 (⋄) are shown together with the average of the control trains (○±s.e.m.). An estimate of the RRP size was obtained by extrapolation to the first EPSC of a line that was fitted through the last 18 points in the curve. Traces and amplitudes shown in A and B are from the same experiment. C, the mean (±s.e.m.) increase in the RRP estimate of all experiments (n = 3) is shown as a function of the number of stimuli in the tetanus. The increase without stimulation is set to zero. D, Pr plotted versus the number of stimuli in a 100 Hz tetanus. The mean Pr was calculated by dividing the first EPSC amplitude of a train by the estimate of the RRP.
Figure 5
Figure 5. Temperature dependence of PTP
A, normalized EPSC amplitudes at RT (n = 9). Axons were stimulated at 0.1 Hz, in the presence of 2 mm kynurenic acid. At t =−1 min, the cell was stimulated with a 100 Hz tetanus of 1 min. Inset shows example currents before (black) and after (grey) the tetanus, with the stimulation artefacts blanked. B, same as in A, only these experiments were done at PT in the presence of 4 mm kynurenic acid (n = 5). C, To compare the decay of PTP at RT (•) to the decay at PT (□), the EPSC values from graphs A and B were normalized to the maximum and plotted on a semilogarithmic scale.
Figure 2
Figure 2. Dynamics of the RRP during PTP
The RRP size was continually probed with short trains of action potentials in the presence of 2 mm kynurenic acid. A, the first 10 traces of a train, before (top), 20 s after (middle) and 80 s after a 100 Hz tetanus of 1 min. Asterisks indicate presynaptic action potential failures. Stimulation artefacts were blanked. B, mean amplitudes during the 200 Hz trains of 4 experiments. ○ are from the test train before the tetanus, • are from a test train 80 s after the tetanus. C, semi-logarithmic plot of the Pr (○) and RRP size (▪) after the tetanus. The values correspond to the values in E and F, but are presented as the change from baseline for comparison of the contribution of both decays to PTP. Double exponential functions were fitted through the mean RRP values (n = 5, continuous line) and mean release probabilities (n = 5, dotted line). D, EPSC amplitudes of the experiment with continuous measurement of the RRP before and after the tetanus ends (t = 0). E, time plot of the mean RRP estimates. F, time plot of the release probabilities.
Figure 3
Figure 3. Age dependence of the increase in RRP and Pr
The increases in RRP size (▪) and Pr(○) are plotted for the different ages of the rats. Only experiments with a 20 Hz tetanus of 5 min are shown. The animals used were 4 (n = 2), 6 (n = 2), 7 (n = 13), 8 (n = 7), 9 (n = 7), 10 (n = 3) or 11 (n = 5) days old.
Figure 4
Figure 4. Frequency dependence of PTP
A, EPSC amplitudes measured in a principal cell from a P10 rat. The cell was tetanized with 6000 stimuli of three different frequencies, as indicated in the top graph by bars. From left to right: 20 Hz, 50 Hz and 100 Hz. B, example traces before (grey) and after (black) the 20 Hz (top), 50 Hz (middle) and 100 Hz (bottom) tetanus. C, mean release probabilities from P9 and P10 slices. PTP was induced with a 20-Hz ○), 50 Hz (□) or 100 Hz (▵) tetanus. D, increase in the size of the RRP for the three different frequencies tested. Experiments were conducted in the presence of kynurenic acid.
Figure 6
Figure 6. RRP dynamics at physiological temperature
The size of the RRP was continuously probed at 37°C, with short 400 Hz trains in 4 mm kynurenic acid. Data of cells stimulated for 20 s to 1 min with a 100 Hz tetanus were pooled. A, the first 10 EPSCs of a train of 25 are shown for the last train before the tetanus (top) and for trains 20 s (middle) and 80 s (bottom) after the tetanus. B, enlargement of the first two EPSCs of control (dotted), 20 s (grey) and 80 s (black, continuous) trains shown in A. Traces were aligned on their prespikes. C, cumulative EPSC plots show the mean values of three experiments at control (○), 20 s (▴) and 80 s (□) after the tetanus. Error bars for the values 20 s after the tetanus are omitted for clarity. The cumulative release curves were fitted with lines (dotted line for control; continuous line, 20 s after the tetanus; dashed line, 80 s after the tetanus). D, the mean normalized RRP estimates from the experiments shown in C are plotted versus time after the tetanus. The RRP was probed with 1 min intervals. E, mean normalized Pr was calculated by dividing the first EPSC amplitude from a train by the RRP estimate. F, EPSCs are preceded by a small prespike which resembles the first derivative of the action potential (examples shown in B). The mean Pr of the first EPSC is plotted versus the mean amplitude of the prespike for the three time points shown in A (n = 3). The prespike amplitudes were normalized to the mean pre-tetanus value.
Figure 7
Figure 7. Contribution of the RRP increase to PTP
The RRP increase 1 min after the tetanus of all cells stimulated with a 20 Hz tetanus was plotted against the amount of PTP. Data at RT (○) were fitted with a line through zero and a slope of 0.17 (continuous line). A similar fit through the data at PT (•, dotted line) resulted in a slope of 0.59. Experiments with depressed EPSCs are not shown, but were included in the fit.

Similar articles

Cited by

References

    1. Awatramani GB, Price GD, Trussell LO. Modulation of transmitter release by presynaptic resting potential and background calcium levels. Neuron. 2005;48:109–121. - PubMed
    1. Bollmann JH, Sakmann B, Borst JGG. Calcium sensitivity of glutamate release in a calyx-type terminal. Science. 2000;289:953–957. - PubMed
    1. Borst JGG, Helmchen F, Sakmann B. Pre- and postsynaptic whole-cell recordings in the medial nucleus of the trapezoid body of the rat. J Physiol. 1995;489:825–840. - PMC - PubMed
    1. Borst JGG, Sakmann B. Calcium influx and transmitter release in a fast CNS synapse. Nature. 1996;383:431–434. - PubMed
    1. Borst JGG, Sakmann B. Effect of changes in action potential shape on calcium currents and transmitter release in a calyx-type synapse of the rat auditory brainstem. Philos Trans R Soc Lond B Biol Sci. 1999;354:347–355. - PMC - PubMed

Publication types