. 2007 Jul 1;110(1):313-22.
doi: 10.1182/blood-2006-10-050260. Epub 2007 Mar 15.

Targeting autophagy augments the anticancer activity of the histone deacetylase inhibitor SAHA to overcome Bcr-Abl-mediated drug resistance

Affiliations

Targeting autophagy augments the anticancer activity of the histone deacetylase inhibitor SAHA to overcome Bcr-Abl-mediated drug resistance

Jennifer S Carew et al. Blood. .

Abstract

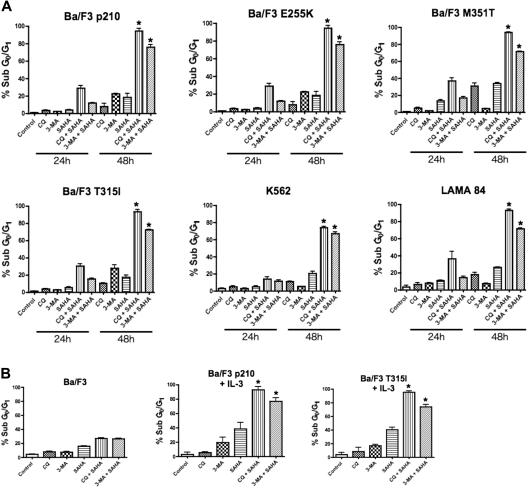
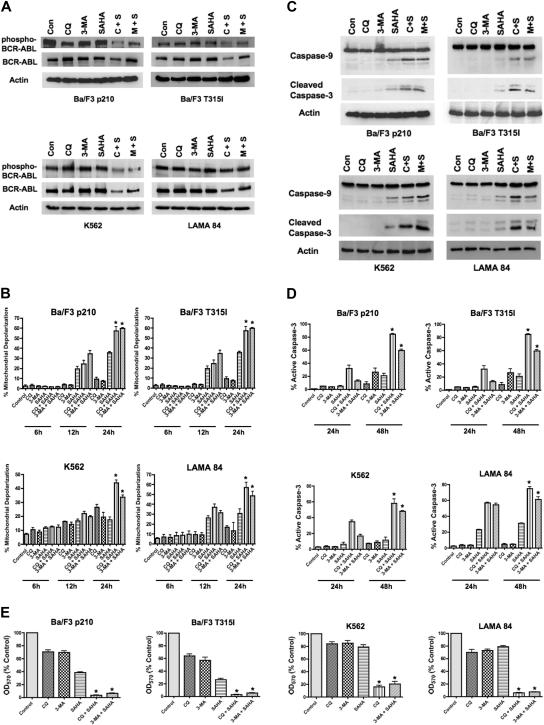
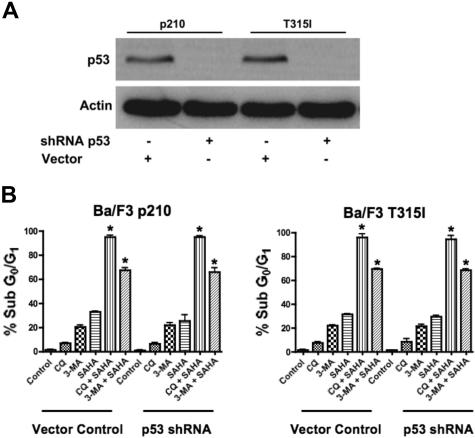
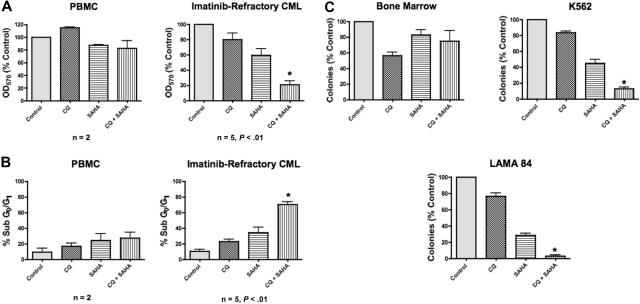
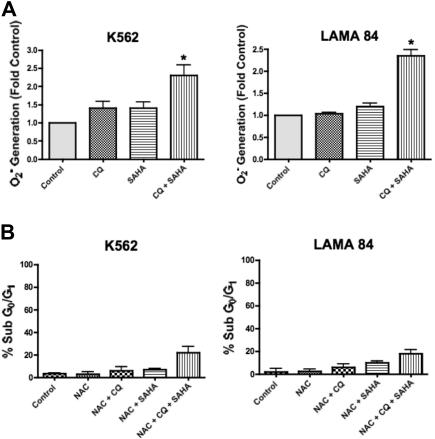
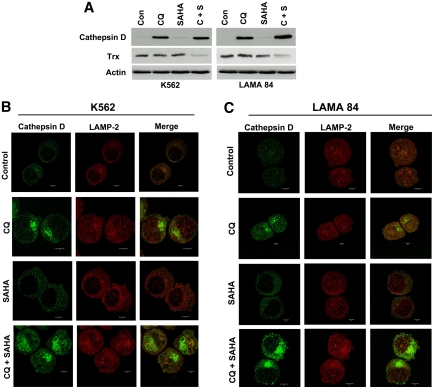
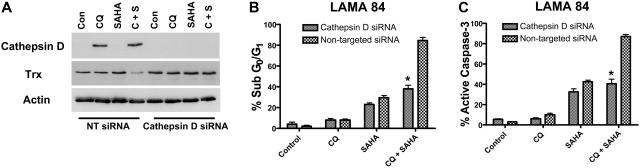
Novel therapeutic strategies are needed to address the emerging problem of imatinib resistance. The histone deacetylase (HDAC) inhibitor suberoylanilide hydroxamic acid (SAHA) is being evaluated for imatinib-resistant chronic myelogenous leukemia (CML) and has multiple cellular effects, including the induction of autophagy and apoptosis. Considering that autophagy may promote cancer cell survival, we hypothesized that disrupting autophagy would augment the anticancer activity of SAHA. Here we report that drugs that disrupt the autophagy pathway dramatically augment the antineoplastic effects of SAHA in CML cell lines and primary CML cells expressing wild-type and imatinib-resistant mutant forms of Bcr-Abl, including T315I. This regimen has selectivity for malignant cells and its efficacy was not diminished by impairing p53 function, another contributing factor in imatinib resistance. Disrupting autophagy by chloroquine treatment enhances SAHA-induced superoxide generation, triggers relocalization and marked increases in the lysosomal protease cathepsin D, and reduces the expression of the cathepsin-D substrate thioredoxin. Finally, knockdown of cathepsin D diminishes the potency of this combination, demonstrating its role as a mediator of this therapeutic response. Our data suggest that, when combined with HDAC inhibitors, agents that disrupt autophagy are a promising new strategy to treat imatinib-refractory patients who fail conventional therapy.


Figures

Figure 1
Figure 1
Chloroquine or 3-methyladenine selectively augments SAHA-induced apoptosis. (A) Time-dependent induction of DNA fragmentation. Ba/F3 cells engineered to express wild-type (p210) or imatinib-resistant (E255K, M351T, T315I) Bcr-Abl were treated with 25 μM CQ, 2 mM 3-MA, 1 μM SAHA, or the indicated combinations for 24 or 48 hours. K562 and LAMA 84 cells were treated with 25 μM CQ, 5 mM 3-MA, 2 μM SAHA, or the indicated combinations also for 24 hours and 48 hours. Percentages of cells with subdiploid DNA were determined by PI/FACS. Results shown represent the mean of 3 independent experiments. Error bars indicate the standard error of the mean (SEM). (B) Targeting autophagy selectively enhances SAHA-induced apoptosis in Bcr-Abl–expressing cells. Ba/F3 vector control cells and Ba/F3 p210 and T315I cells, cultured in the presence of 20 units/mL of IL-3, were treated with 25 μM CQ, 2 mM 3-MA, 1 μM SAHA, or the indicated combinations for 48 hours. Percentages of apoptotic cells were quantified by PI/FACS. n = 3; error bars represent the SEM. *P < .05.
Figure 2
Figure 2
SAHA-induced cell death is augmented by chloroquine or 3-methyladenine. (A) Effects of drug treatments on Bcr-Abl autophosphorylation. p210- and T315I-expressing Ba/F3 cells were treated for 24 hours with 25 μM CQ, 2 mM 3-MA, 1 μM SAHA, or the indicated combinations. K562 and LAMA 84 cells were treated for 24 hours with 25 μM CQ, 5 mM 3-MA, 2 μM SAHA, or the indicated combinations. Protein lysates were subjected to SDS-PAGE, blotted, and probed with phospho-Bcr– or c-Abl–specific antibodies. Actin was used as a loading control. C+S indicates CQ plus SAHA; M+S, 3-MA plus SAHA. (B) SAHA-induced mitochondrial depolarization is enhanced by CQ or 3-MA. Ba/F3 p210 and T315I cells were treated with 25 μM CQ, 2 mM 3-MA, and 1 μM SAHA, and K562 and LAMA 84 cells were treated with 25 μM CQ, 5 mM 3-MA, 2 μM SAHA, or the indicated combinations for 6, 12, and 24 hours. Mitotracker Red CMXRos was used to assess the mitochondrial transmembrane potential status. Bars represent the mean of 3 independent experiments; error bars indicate the SEM. (C) CQ and 3-MA enhance SAHA-induced caspase-9 and -3 activation. Ba/F3 p210- and T315I-expressing cells were treated for 24 hours with 25 μM CQ, 2 mM 3-MA, and 1 μM SAHA, and K562 and LAMA 84 cells were treated for 24 hours with 25 μM CQ, 5 mM 3-MA, 2 μM SAHA, or the indicated combinations. Protein lysates were subjected to SDS-PAGE, blotted, and probed with caspase-9– and cleaved caspase-3–specific antibodies. Actin was used as a loading control. (D) Chloroquine and 3-MA enhance SAHA-induced caspase-3 activation. Ba/F3 cells expressing wild-type (p210) or imatinib-resistant (T315I) BCR-ABL were treated with 25 μM CQ, 2 mM 3-MA, and 1 μM SAHA, and K562 and LAMA 84 cells were treated with 25 μM CQ, 5 mM 3-MA, 2 μM SAHA, or the indicated combinations for 24 hours or 48 hours. The percentage of cells containing the active (cleaved) form of caspase-3 was quantified using flow cytometry. Bars represent the mean of 3 independent experiments. Error bars indicate the SEM. (E) Effects of CQ, 3-MA, SAHA, and combinations on overall cell growth and viability. Ba/F3 p210 and Ba/F3 T315I cells were treated with 25 μM CQ, 2 mM 3-MA, 1 μM SAHA, or the indicated combinations for 48 hours. K562 and LAMA 84 cells were treated with 25 μM CQ, 5 mM 3-MA, 2 μM SAHA, or the indicated combinations for 48 hours. Cell viability was determined by MTT assay. n = 3; error bars indicate the SEM. *P < .05.
Figure 3
Figure 3
Functional p53 is not required for chloroquine or 3-methyladenine to synergize with SAHA. (A) shRNA-mediated knockdown of p53 in Ba/F3 p210 and Ba/F3 T315I cells. Actin was used as a loading control. (B) Quantification of drug-induced apoptosis. Vector control and p53 shRNA-expressing p210 and T315I Ba/F3 cells were treated with 25 μM CQ, 2 mM 3-MA, 1 μM SAHA, or the indicated combinations for 48 hours. Percentages of apoptotic cells were quantified by PI/FACS. Bars represent the mean of 3 independent experiments. Error bars indicate the SEM. *P < .05.
Figure 4
Figure 4
Chloroquine selectively augments the anticancer activity of SAHA in imatinib-refractory primary CML cells. (A) Effects of CQ, SAHA, and the combination on the overall growth and viability of peripheral-blood mononuclear cells (PBMCs) from healthy donors (n = 2) and primary cells from imatinib-refractory patients (n = 5). Cells were treated with 25 μM CQ, 2 μM SAHA, or the combination for 48 hours. Effects on overall growth and viability were determined by MTT assays. Error bars indicate the SEM. (B) Quantification of drug-induced apoptosis in PBMCs from healthy donors (n = 2) and primary CML cells from imatinib-refractory patients (n = 5). Cells were treated with 25 μM CQ, 2 μM SAHA, or the combination for 48 hours. Drug-induced apoptosis was determined by PI/FACS. Error bars indicate the SEM. (C) Prolonged effects of CQ, SAHA, and the combination on the clonogenic survival of normal bone marrow versus CML cells. Primary bone marrow cells harvested from C57BL/6J mice and K562 and LAMA 84 CML cells were treated for 24 hours with 25 μM CQ, 2 μM SAHA, and the combination. Cells were washed twice in PBS and plated in cytokine-free Methocult medium. The Methocult for murine bone marrow cells was supplemented with 20 units/mL IL-3. Colonies from K562 and LAMA 84 cells were scored after 8 days and murine bone marrow colonies were scored after 14 days in culture. n = 2; error bars represent the SEM. *P < .05.
Figure 5
Figure 5
Chloroquine augments SAHA-induced superoxide generation, which mediates cell death. (A) Quantification of cellular superoxide generation. K562 and LAMA 84 CML cells were treated with 25 μM CQ, 2 μM SAHA, or the combination for 12 hours. Superoxide production was determined by hydroethidine staining in conjunction with flow cytometry as described in Quantitation of intracellular superoxide generation in P‘Patients, materials, and methods.” n = 3; error bars represent the SEM. *P < .05. (B) Effects of NAC on drug-induced cell death. K562 and LAMA 84 cells were pretreated with 10 mM NAC for 3 hours. Following pretreatment with NAC, cells were exposed to 25 μM CQ, 2 μM SAHA, or the combination for 48 hours. Drug-induced apoptosis was quantified by PI/FACS. n = 3; error bars represent the SEM.
Figure 6
Figure 6
Chloroquine and SAHA increase the expression and alter the subcellular localization of cathepsin D and reduce the levels of its substrate thioredoxin (Trx). (A) Drug-induced modulation of cathepsin-D and Trx expression. K562 and LAMA 84 CML cells were treated with 25 μM CQ, 2 μM SAHA, or the combination for 24 hours. Immunoblotting was used to evaluate cathepsin-D and Trx expression. Actin was used as a loading control. (B-C) Subcellular localization of cathepsin D. K562 (B) and LAMA 84 (C) cells were treated with 25 μM CQ, 2 μM SAHA, or the combination for 18 hours. Cells were centrifuged at 150g onto glass slides and stained with anti–cathepsin-D and anti–LAMP-2 (lysosomal marker) antibodies as described in Confocal Microscopy in “Patients, materials, and methods.” Cells were visualized by confocal microscopy. Magnification, × 40.
Figure 7
Figure 7
Knockdown of cathepsin D diminishes the potency of the chloroquine-SAHA combination and restores Trx expression. (A) siRNA knockdown of cathepsin D. Cathepsin-D–targeted or nontargeted siCONTROL siRNA were transfected into LAMA 84 CML cells using the Nucleofector II. Transfected cells were treated with 25 μM CQ, 2 μM SAHA, or the combination for 24 hours. Immunoblotting was used to evaluate the efficiency of cathepsin D knockdown. Actin served as a loading control. (B-C) Quantification of drug-induced apoptosis. LAMA 84 CML cells transfected with cathepsin D–targeted or siCONTROL siRNA were treated with 25 μM CQ, 2 μM SAHA, or the combination for 24 hours. Apoptosis was quantified by PI/FACS (B) and active caspase-3 staining (C). n = 3, error bars represent the SEM. *P < .05.

References

    1. Shah NP, Sawyers CL. Recent success with the tyrosine kinase inhibitor STI-571–lessons for targeted therapy of cancer. Curr Opin Investig Drugs. 2001;2:422–423. - PubMed
    1. Shah NP, Nicoll JM, Nagar B, et al. Multiple BCR-ABL kinase domain mutations confer polyclonal resistance to the tyrosine kinase inhibitor imatinib (STI571) in chronic phase and blast crisis chronic myeloid leukemia. Cancer Cell. 2002;2:117–125. - PubMed
    1. Shah NP, Sawyers CL. Mechanisms of resistance to STI571 in Philadelphia chromosome-associated leukemias. Oncogene. 2003;22:7389–7395. - PubMed
    1. Wendel HG, de Stanchina E, Cepero E, et al. Loss of p53 impedes the antileukemic response to BCR-ABL inhibition. Proc Natl Acad Sci U S A. 2006;103:7444–7449. - PMC - PubMed
    1. O'Hare T, Corbin AS, Druker BJ. Targeted CML therapy: controlling drug resistance, seeking cure. Curr Opin Genet Dev. 2006;16:92–99. - PubMed

Publication types

MeSH terms