. 2007 Apr;117(4):902-9.
doi: 10.1172/JCI29919. Epub 2007 Mar 15.

Critical roles for CCR2 and MCP-3 in monocyte mobilization from bone marrow and recruitment to inflammatory sites

Affiliations

Critical roles for CCR2 and MCP-3 in monocyte mobilization from bone marrow and recruitment to inflammatory sites

Chia-Lin Tsou et al. J Clin Invest. 2007 Apr.

Abstract

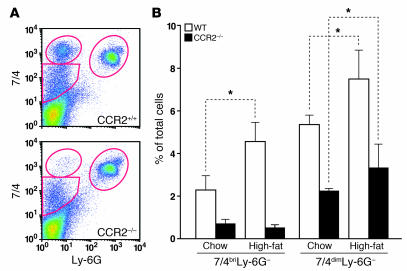
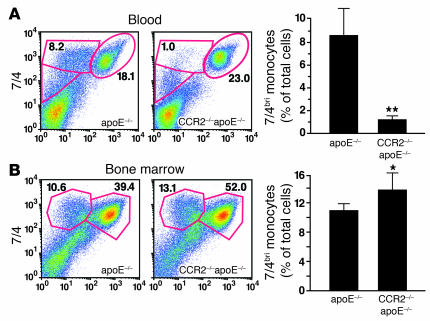
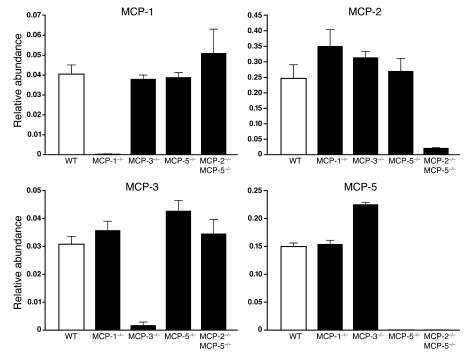
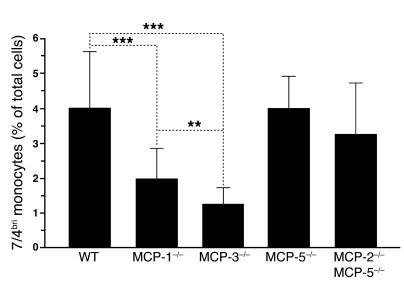
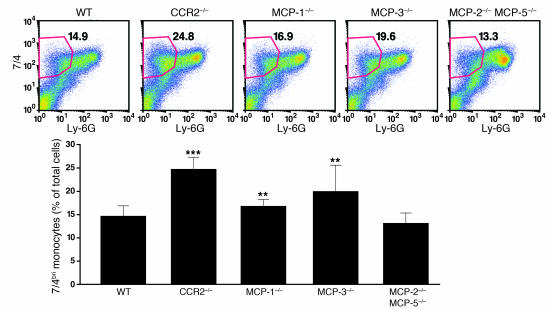
Monocyte recruitment to sites of inflammation is regulated by members of the chemokine family of chemotactic cytokines. However, the mechanisms that govern the migration of monocytes from bone marrow to blood and from blood to inflamed tissues are not well understood. Here we report that CC chemokine receptor 2 (CCR2) is highly expressed on a subpopulation of blood monocytes whose numbers are markedly decreased in CCR2(-/-) mice. In bone marrow, however, CCR2(-/-) mice had an increased number of monocytes, suggesting that CCR2 is critical for monocyte egress. Intravenous infusion of ex vivo-labeled WT or CCR2(-/-) bone marrow into WT recipient mice demonstrated that CCR2 is necessary for efficient monocyte recruitment from the blood to inflamed tissue. Analysis of mice lacking monocyte chemoattractant protein-1 (MCP-1), MCP-3, MCP-5, or MCP-2 plus MCP-5 revealed that MCP-3 and MCP-1 are the CCR2 agonists most critical for the maintenance of normal blood monocyte counts. These findings provide evidence that CCR2 and MCP-3/MCP-1 are critical for monocyte mobilization and suggest new roles for monocyte chemoattractants in leukocyte homeostasis.


Figures

Figure 1
Figure 1. FACS analysis of murine peripheral blood leukocytes.
(A) After lysis of red blood cells, leukocytes were stained with antibodies specific to 7/4 and Ly-6G to reveal a population of pure monocytes (7/4briLy-6G), a population of pure neutrophils (7/4briLy-6G+), and a mixed population of monocytes, T cells, and B cells (7/4dimLy-6G). (B and C) Expression levels of F4/80 (B) and CCR2 (C) on populations of monocytes (7/4briLy-6G), neutrophils (7/4briLy-6G+), and mixed leukocytes (7/4dimLy-6G). Gates were set so that no cells were included in the absence of the primary antibody. Numbers are percentages of total leukocytes in each population. (D) Expression of CCR2 on monocytes (7/4briLy-6G) and mixed leukocytes (7/4dimLy-6G).
Figure 2
Figure 2. Monocytopenia in CCR2–/– mice.
FACS plots of leukocytes obtained from 4 CCR2+/+ mice (A) and 4 CCR2–/– mice (B) and stained for 7/4 and Ly-6G. (C) Quantification FACS plot data. Values are mean ± SD. The total leukocyte count did not differ in CCR2+/+ and CCR2–/– mice. Typical absolute counts for the monocyte population (7/4briLy-6G) were 2.7 × 10⁵ for CCR2+/+ mice and 0.4 × 10⁵ for CCR2–/– mice. For the mixed leukocyte populations (7/4dimLy-6G), the typical counts were 9.4 × 10⁵ for CCR2+/+ mice and 3.5 × 10⁵ for CCR2–/– mice. *P < 0.05.
Figure 3
Figure 3. Effect of a high-fat diet on blood monocytes in CCR2+/+ and CCR2–/– mice.
Mice were fed regular laboratory chow or a high-fat Western diet for 45 weeks before sacrifice. (A) Typical FACS plots of total blood leukocytes obtained from CCR2+/+ and CCR2–/– mice on the Western diet and stained for 7/4 and Ly-6G as described in Figure 1. (B) Quantification of the FACS data showed an increase in the 7/4bri (monocyte) population in CCR2+/+, but not in CCR2–/–, mice in response to the high-fat diet. The mixed leukocyte population (7/4dim) had a more modest increase. Values are mean ± SD. n = 4 mice per genotype. *P < 0.05.
Figure 4
Figure 4. Monocyte retention in the bone marrow in CCR2–/– mice.
apoE–/– mice were fed a high-fat Western diet for 3.5 weeks. (A) CCR2–/– mice had fewer 7/4bri monocytes in the blood than CCR2+/+ mice. **P < 0.01; n = 4 mice per group. (B) Bone marrow cells were recovered and stained with 7/4 and Ly-6G. CCR2–/– mice had an increase in the 7/4bri population. Error bars represent SD. *P < 0.05; n = 4 mice per group.
Figure 5
Figure 5. Relative abundance of MCPs in MCP-1–/– mice and newly created MCP-3–/–, MCP-5–/–, and MCP-2–/–MCP-5–/– mice.
The mice were immunized with keyhole limpet hemocyanin/CFA, and MCP mRNA levels in the draining lymph node were quantified by real-time PCR to confirm the specificity and completeness of the gene deletion.
Figure 6
Figure 6. Decrease in the level of 7/4briLy-6G monocytes in MCP-3–/– and MCP-1–/– mice.
Values in bar graphs are mean ± SD. Data from 10 independent experiments are combined. WT (n = 66), MCP-1–/– (n = 21), MCP-3–/– (n = 17), MCP-5–/– (n = 10), MCP-2–/–MCP-5–/– (n = 12). **P < 0.01; ***P < 0.001.
Figure 7
Figure 7. Monocyte retention in the bone marrow in MCP-1–/– and MCP-3–/– mice.
Mice received intraperitoneal thioglycollate. Bone marrow cells were harvested 1 day later and stained with 7/4 and Ly-6G. The FACS gate was established by staining total bone marrow from WT mice for CCR2+ cells and then copying the gate onto the 7/4–versus–Ly-6G plot. WT (n = 8), MCP-1–/– (n = 8), MCP-3–/– (n = 8), MCP-2–/–MCP-5–/– (n = 9). **P < 0.01; ***P < 0.001.
Figure 8
Figure 8. Transient rise in serum chemokine levels following intraperitoneal instillation of thioglycollate.
Thioglycollate was instilled into the peritoneal cavity of the mice, and serum concentrations of MCP-1, MCP-3, and MCP-5 were quantified by ELISA at the indicated time points. Results are typical of 2 experiments with 4–5 mice per genotype. Error bars represent SD.
Figure 9
Figure 9. Adoptive transfer of bone marrow cells.
Bone marrow was harvested from CCR2+/+ and CCR2–/– mice, labeled with CFSE, and infused intravenously into WT recipients. Thioglycollate was instilled into the peritoneal cavity of the recipient mice coincident with the bone marrow infusion, and the peritoneal cells were harvested 66 hours later. FACS plots of F4/80+CFSE+ leukocytes from mice infused with labeled CCR2+/+ (A) and CCR2–/– (B) bone marrow. (C) Quantification of FACS plots. Values are mean ± SD of the total number of peritoneal leukocytes present. n = 4 mice per genotype; *P < 0.05 versus WT. Results are typical of 2 experiments.

References

    1. Charo I.F., Ransohoff R.M. The many roles of chemokines and chemokine receptors in inflammation. N. Engl. J. Med. 2006;354:610–621. - PubMed
    1. Gerard C., Rollins B.J. Chemokines and disease. Nat. Immunol. 2001;2:108–115. - PubMed
    1. Charo I.F., et al. Molecular cloning and functional expression of two monocyte chemoattractant protein 1 receptors reveals alternative splicing of the carboxyl-terminal tails. Proc. Natl. Acad. Sci. U. S. A. 1994;91:2752–2756. - PMC - PubMed
    1. Boring L., et al. Impaired monocyte migration and reduced type 1 (Th1) cytokine responses in C-C chemokine receptor 2 knockout mice. J. Clin. Invest. 1997;100:2552–2561. - PMC - PubMed
    1. Izikson L., et al. Resistance to experimental autoimmune encephalomyelitis in mice lacking the CC chemokine receptor (CCR)2. J. Exp. Med. 2000;192:1075–1080. - PMC - PubMed

Publication types

MeSH terms