

Hyperoxia inhibits several critical aspects of vascular development
- PMID: 17366630
- PMCID: PMC4942183
- DOI: 10.1002/dvdy.21122
Hyperoxia inhibits several critical aspects of vascular development
Abstract
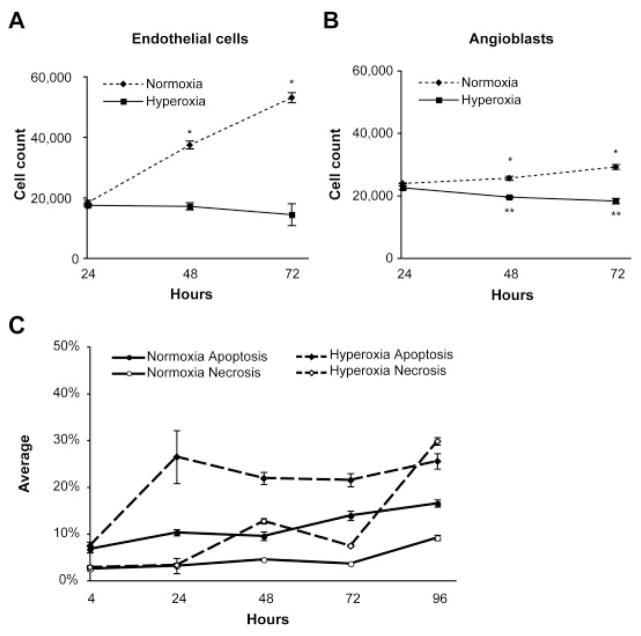
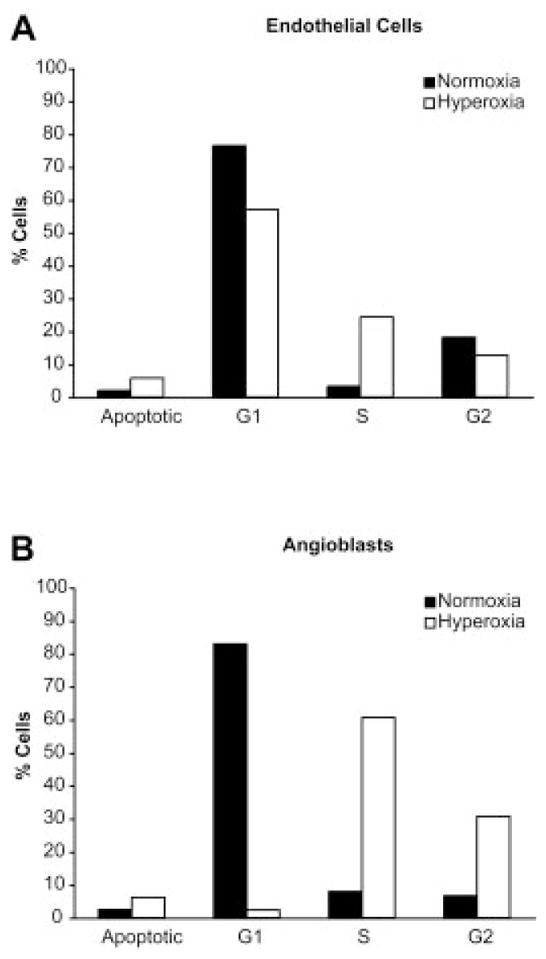
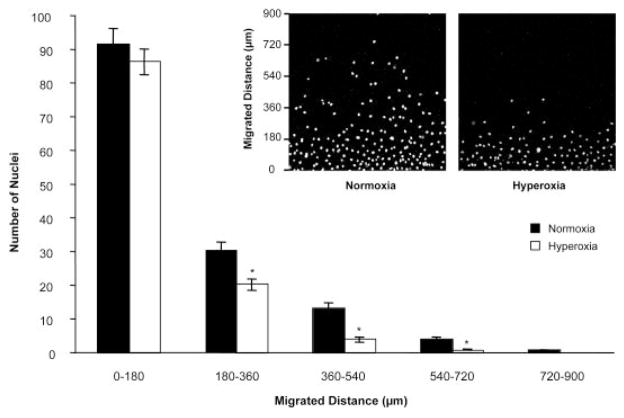
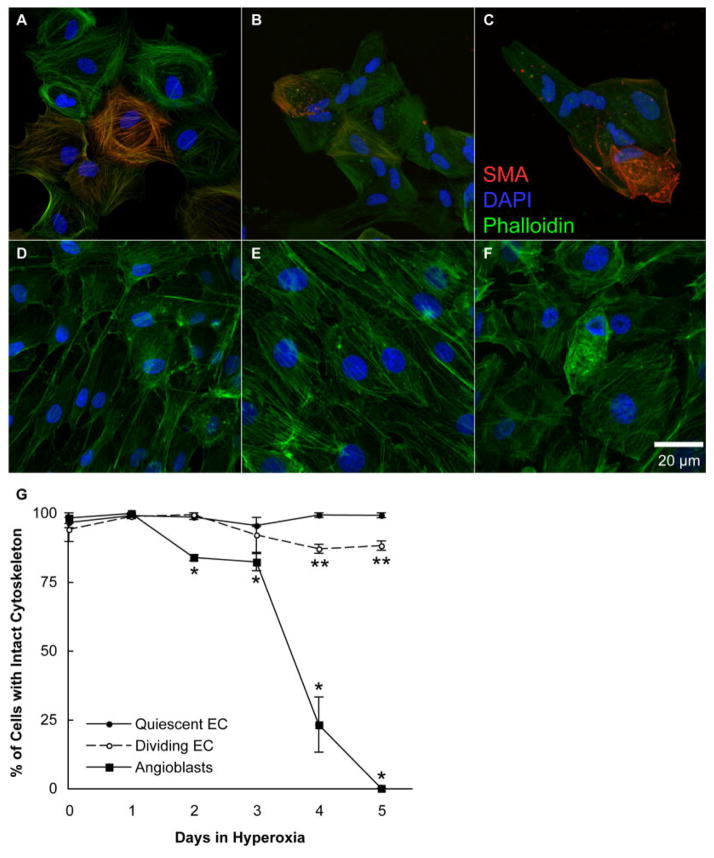
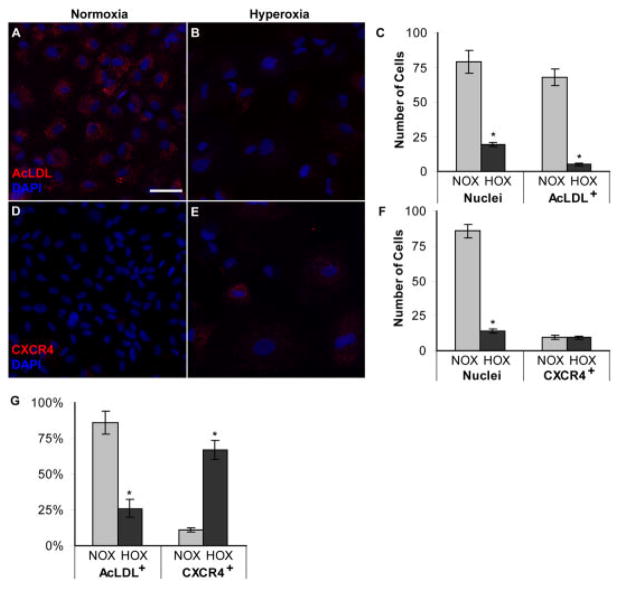
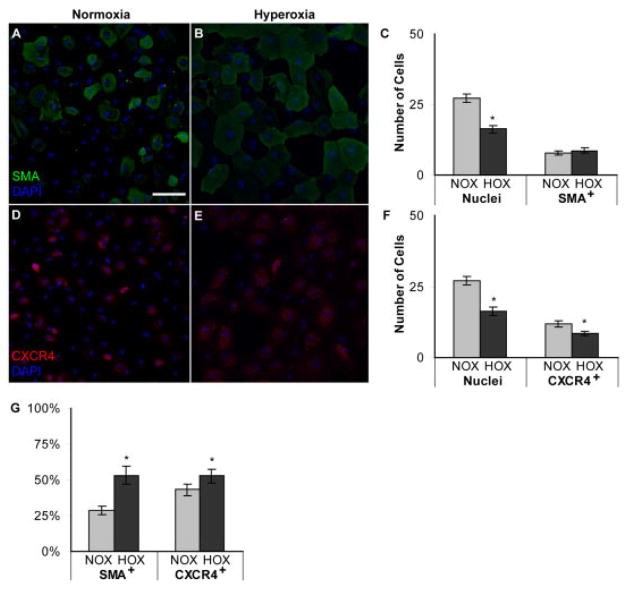
Normal human retinal vascular development uses angiogenesis and vasculogenesis, both of which are interrupted in the vaso-obliteration phase of retinopathy of prematurity (ROP). Canine oxygen-induced retinopathy (OIR) closely resembles human ROP. Canine retinal endothelial cells (ECs) and angioblasts were used to model OIR and characterize the effects of hyperoxia on angiogenesis and vasculogenesis. Cell cycle analysis showed that hyperoxia reduced the number of G1 phase cells and showed increased arrest in S phase for both cell types. Migration of ECs was significantly inhibited in hyperoxia (P < 0.01). Hyperoxia disrupted the cytoskeleton of angioblasts but not ECs after 2 days. Differentiation of angioblasts into ECs (determined by acetylated low-density lipoprotein uptake) was evaluated after basic fibroblast growth factor treatment. Differentiation of angioblasts into pericytes was determined by smooth muscle actin expression after treatment with platelet-derived growth factor. Differentiation into ECs was significantly inhibited by hyperoxia (P < 0.0001). The percentage of CXCR4(+) cells (a marker for retinal vascular precursors) increased in both treatment groups after hyperoxia. These data show novel mechanisms of hyperoxia-induced disruption of vascular development.
Figures
Similar articles
-
Canine retinal angioblasts are multipotent.Exp Eye Res. 2006 Jul;83(1):183-93. doi: 10.1016/j.exer.2005.09.025. Epub 2006 Mar 20. Exp Eye Res. 2006. PMID: 16545371
-
Targeting VEGF in canine oxygen-induced retinopathy - a model for human retinopathy of prematurity.Eye Brain. 2016 May 20;8:55-65. doi: 10.2147/EB.S94443. eCollection 2016. Eye Brain. 2016. PMID: 28539802 Free PMC article.
-
Localization of adenosine A2a receptor in retinal development and oxygen-induced retinopathy.Invest Ophthalmol Vis Sci. 2000 Jan;41(1):230-43. Invest Ophthalmol Vis Sci. 2000. PMID: 10634625
-
Retinal vascular development and oxygen-induced retinopathy: a role for adenosine.Prog Retin Eye Res. 2003 Jan;22(1):95-111. doi: 10.1016/s1350-9462(02)00058-7. Prog Retin Eye Res. 2003. PMID: 12597925 Review.
-
[Endothelial progenitor cell biology in retinopathy of prematurity].Nippon Ganka Gakkai Zasshi. 2013 Nov;117(11):893-902. Nippon Ganka Gakkai Zasshi. 2013. PMID: 24397186 Review. Japanese.
Cited by
-
Targeting adenosine A2A receptors for early intervention of retinopathy of prematurity.Purinergic Signal. 2024 Feb 8. doi: 10.1007/s11302-024-09986-x. Online ahead of print. Purinergic Signal. 2024. PMID: 38329708 Review.
-
Comparison of Preterm and Term Wharton's Jelly-Derived Mesenchymal Stem Cell Properties in Different Oxygen Tensions.Cells Tissues Organs. 2018;205(3):137-150. doi: 10.1159/000489256. Epub 2018 Jun 27. Cells Tissues Organs. 2018. PMID: 29949803 Free PMC article.
-
Salidroside Prevents Hypoxia-Induced Human Retinal Microvascular Endothelial Cell Damage Via miR-138/ROBO4 Axis.Invest Ophthalmol Vis Sci. 2021 Jul 1;62(9):25. doi: 10.1167/iovs.62.9.25. Invest Ophthalmol Vis Sci. 2021. PMID: 34269814 Free PMC article.
-
Oxygen transporter for the hypoxic transplantation site.Biofabrication. 2018 Dec 7;11(1):015011. doi: 10.1088/1758-5090/aaf2f0. Biofabrication. 2018. PMID: 30524058 Free PMC article.
-
Docosahexaenoic acid improves the nitroso-redox balance and reduces VEGF-mediated angiogenic signaling in microvascular endothelial cells.Invest Ophthalmol Vis Sci. 2010 Dec;51(12):6815-25. doi: 10.1167/iovs.10-5339. Epub 2010 Aug 11. Invest Ophthalmol Vis Sci. 2010. PMID: 20702831 Free PMC article.
References
-
- Alon T, Hemo I, Itin A, Pe’er J, Stone J, Keshet E. Vascular endothelial growth factor acts as a survival factor for newly formed retinal vessels and has implications for retinopathy of prematurity. Nat Med. 1995;1:1024–1028. - PubMed
-
- Bikfalvi A, Klein S, Pintucci G, Rifkin DB. Biological roles of fibroblast growth factor-2. Endocr Rev. 1997;18:26–45. - PubMed
-
- Chan-Ling T, McLeod DS, Hughes S, Baxter L, Chu Y, Hasegawa T, Lutty GA. Astrocyte-endothelial cell relationships during human retinal vascular development. Invest Ophthalmol Vis Sci. 2004;45:2020–2032. - PubMed
-
- D’Amore PA, Sweet E. Effects of hyperoxia on microvascular cells in vitro. In Vitro Cell Dev Biol. 1987;23:123–128. - PubMed
-
- Gong J, Traganos F, Darzynkiewicz Z. Staurosporine blocks cell progression through G1 between the cyclin D and cyclin E restriction points. Cancer Res. 1994;54:3136–3139. - PubMed
Publication types
MeSH terms
Substances
Grants and funding
LinkOut - more resources
Full Text Sources
Other Literature Sources
