. 2007 Mar 16;3(3):e36.
doi: 10.1371/journal.pcbi.0030036. Epub 2007 Jan 9.

A mathematical model for neutrophil gradient sensing and polarization

Affiliations

A mathematical model for neutrophil gradient sensing and polarization

Matthew Onsum et al. PLoS Comput Biol. .

Abstract

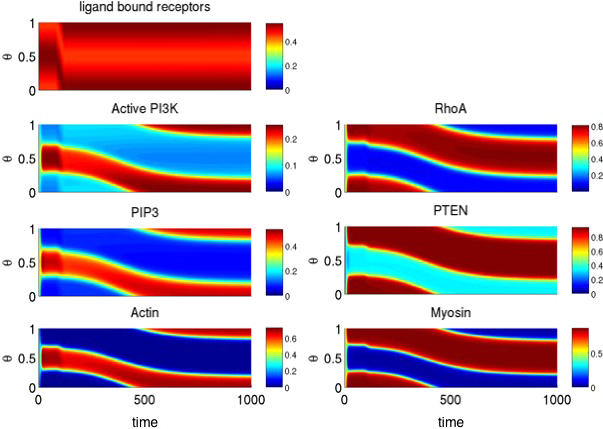
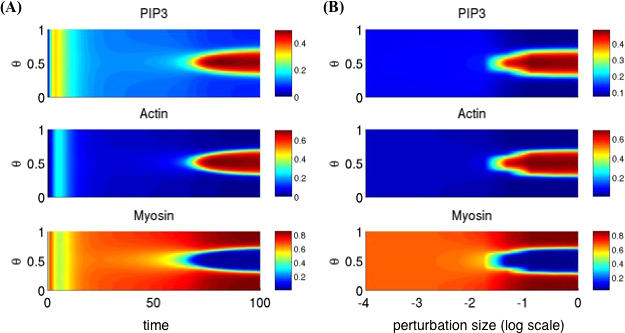
Directed cell migration in response to chemical cues, also known as chemotaxis, is an important physiological process involved in wound healing, foraging, and the immune response. Cell migration requires the simultaneous formation of actin polymers at the leading edge and actomyosin complexes at the sides and back of the cell. An unresolved question in eukaryotic chemotaxis is how the same chemoattractant signal determines both the cell's front and back. Recent experimental studies have begun to reveal the biochemical mechanisms necessary for this polarized cellular response. We propose a mathematical model of neutrophil gradient sensing and polarization based on experimentally characterized biochemical mechanisms. The model demonstrates that the known dynamics for Rho GTPase and phosphatidylinositol-3-kinase (PI3K) activation are sufficient for both gradient sensing and polarization. In particular, the model demonstrates that these mechanisms can correctly localize the "front" and "rear" pathways in response to both uniform concentrations and gradients of chemical attractants, including in actin-inhibited cells. Furthermore, the model predictions are robust to the values of many parameters. A key result of the model is the proposed coincidence circuit involving PI3K and Ras that obviates the need for the "global inhibitors" proposed, though never experimentally verified, in many previous mathematical models of eukaryotic chemotaxis. Finally, experiments are proposed to (in)validate this model and further our understanding of neutrophil chemotaxis.


Conflict of interest statement

Competing interests. The authors have declared that no competing interests exist.

Figures

Figure 1
Figure 1. Proposed Pathway for Neutrophil Chemotaxis
Chemoattractant-bound G protein–coupled receptors activate both the “front” and “back” pathways. The “front” pathway activates F-actin polymerization and the “back” pathway activates myosin contractions. The two pathways cross-inhibit each other at five junctions (four are denoted by the dashed lines and the other results from the antagonizing action of PI3K and PTEN).
Figure 2
Figure 2. Separation of Front and Back Molecules in Response to a 50% Gradient of Chemoattractant
Spatial and temporal distribution of the front (left) and back (right) signaling molecules. The abscissa is time (dimensionless), the ordinate θ, taking values between zero and one, is the position on the membrane, and the color intensity denotes the concentration. Chemoattractant concentration on the surface of the cell was specified by the function L(θ) = 1 − 0.25 cos(2πθ). The gradient direction rotates by 180° from t = 80 − 120. One dimensionless time unit corresponds roughly to 0.05 s in real time [53].
Figure 3
Figure 3. Response to Fast and Slow Rotating Gradients
Time to complete 180° rotation is 0.01 (A) and 100 (B) time units. Abscissa is time, ordinate is location on cell periphery, and color denotes concentration. Chemoattractant concentration on the surface of the cell was specified by the function L(θ) = 1 − 0.25 cos(2πθ).
Figure 4
Figure 4. Mechanism for Polarization
Receptor–chemoattractant complexes (black dashed) sharply localize activated PI3K (red) to the front via the PI3K/Ras coincidence circuit. Activated PI3K localizes actin (not shown) which inhibits RhoA (blue) from localizing to the front. The abscissa (θ) is the location on the cell periphery. Chemoattractant concentration on the surface of the cell was specified by the function L(θ) = 1 − 0.25 cos(2πθ).
Figure 5
Figure 5. Dynamic Range of Gradient Sensing Mechanism
The formula for the chemoattractant concentration on the surface of the cell as a function of the gradient strength (gL) and background concentration (bL) is given in the text. (A) Steady-state distribution of PIP3, actin, and myosin in response to chemoattractant gradients of increasing steepness with the background concentration of chemoattractant fixed at bL = 1. (B) Steady-state distribution of PIP3, actin, and myosin for a 10% gradient (gL = 10%) with increasing background concentrations of chemoattractant.
Figure 6
Figure 6. Effect of F-Actin Inhibitor on Signal Polarization
Steady-state distribution of receptor–chemoattractant complexes (black), activated PI3K (red), and RhoA(blue). The simulations were performed using a 100% gradient (bL = 1 and gL = 100%). Weaker gradients yielded a flatter response as the inhibition of actin decreases the sensitivity of the response.
Figure 7
Figure 7. The Effect of a Positive Feedback Loop Involving PIP3 on PIP3 (Blue) and Actin (Red) Back-to-Front Localization
The model was simulated with the autocatalytic PIP3 reaction (fb, solid lines) and without (dashed lines). The ordinate is molecular concentration and the abscissa is the position on the membrane (θ).
Figure 8
Figure 8. Partial Adaptation to a Uniform Increase in Chemoattractant
(A) Adaptation around cell periphery. (B) Dynamics of adaptation at one point on the membrane (θ = 0.5).
Figure 9
Figure 9. Spontaneous Polarization in Response to Uniform Addition of Chemoattractant
(A) Dynamic response to the addition of chemoattractant (bL = 1 and gL = 0%) with a perturbation of magnitude 0.1 made to the receptor–ligand complex at θ = 0.5. (B) Sensitivity of spontaneous polarization to perturbation size. Steady-state distribution of PIP3, actin, and myosin in response to uniform addition of chemoattractant (bL = 1 and gL = 0%) with perturbations of increasing size made to the receptor–ligand complex at θ = 0.5.
Figure 10
Figure 10. Double Micropipette Experiment
Steady-state distribution of PIP3, actin, and myosin in response to two opposing micropipettes placed equidistantly around the cell. One gradient was fixed and the second was varied in intensity. The relative strength is the ratio of the peak concentrations of the two chemoattractant sources. When the chemoattractant profiles of the micropipettes are equal (relative strength equal to one), the cell forms two fronts and two backs. When one micropipette has a significantly higher peak concentration than the other, only one front and one back forms. The nominal parameters for both gradients is bL = 1 and gL = 50%.
Figure 11
Figure 11. Triple Micropipette Experiment
Three gradients of equal intensity (bL = 1 and gL = 0%) are placed equidistantly around the cell.
Figure 12
Figure 12. Sensitivity of Polarization to Parameter Values
(A) As the ratio of PI3K binding sites to PI3K (γ PI3K) decreases, the amount of PIP3 and actin bound on the membrane increases. (B) Polarization is insensitive to the association rate constant of RhoA (aRh).
Figure 13
Figure 13. Alternative Model of Gradient Sensing and Spontaneous Polarization
(A) Spatial and temporal distribution of ligand-bound receptors, actin, and myosin in response to a 50% gradient of chemoattractant. Gradient direction rotates by 180° from t = 80 − 120s. (B) Spontaneous polarization in response to a uniform stimulation (bL = 1) with a perturbation of size 0.1 made to the receptor–ligand complex at θ = 0.5. Note that myosin localizes at the site of the perturbation. This behavior is opposite that of the original model.
Figure 14
Figure 14. Predicted Effect of Ras Gap Mutation and Constitutively Active Ras
(A) Ras gap mutation was simulated by decreasing the rate of Ras deactivation (dR) by a factor of 10. The model still polarizes towards the gradient of attractant, but its response to a rotating gradient is slower. (B) Constitutively active Ras was simulated by setting the Ras deactivation rate (dR) to zero. The model polarizes towards the chemoattractant but cannot track a rotating gradient.

Similar articles

Cited by

References

    1. Manahan C, Iglesias P, Long Y, Deverotes P. Chemoattractant signaling in dictyostelium discoideum. Annu Rev Cell Dev Biol. 2004;20:223–253. - PubMed
    1. van Haastert P, Devreotes P. Chemotaxis: Signalling the way forward. Nat Rev Mol Cell Biol. 2004;5:626–634. - PubMed
    1. Li S, Guan J, Chein S. Biochemistry and biomechanics of cell motility. Annu Rev Biomed Eng. 2005;7:105–150. - PubMed
    1. Schiffmann E. Leukocyte chemotaxis. Annu Rev Physiol. 1982;44:553–568. - PubMed
    1. Deverotes P, Zigmond S. Chemotaxis in eukaryotic cells: A focus on leukocytes and Dictyostelium . Annu Rev Cell Biol. 1988;4:649–686. - PubMed

Publication types

MeSH terms

Substances