. 2007 Mar 16;3(3):e45.
doi: 10.1371/journal.pcbi.0030045.

Modeling networks of coupled enzymatic reactions using the total quasi-steady state approximation

Affiliations

Modeling networks of coupled enzymatic reactions using the total quasi-steady state approximation

Andrea Ciliberto et al. PLoS Comput Biol. .

Abstract

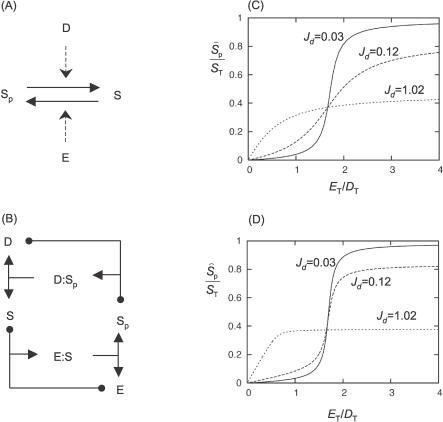
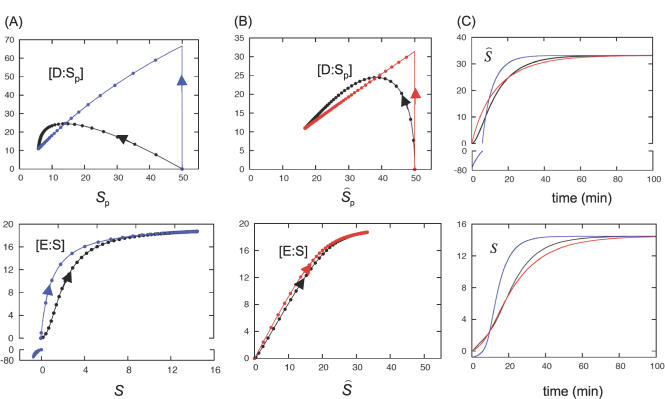
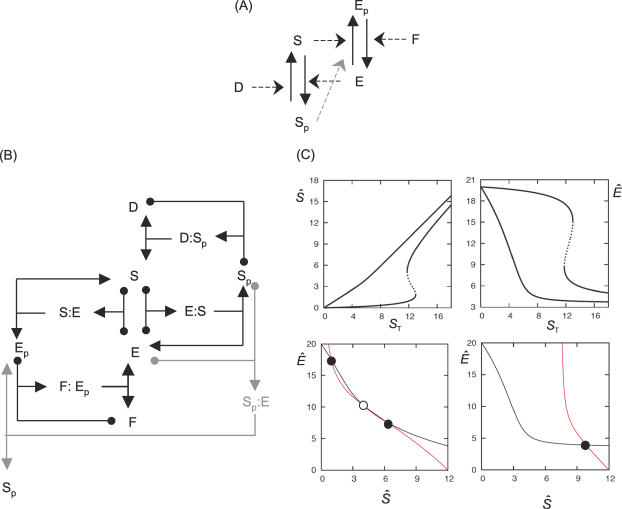
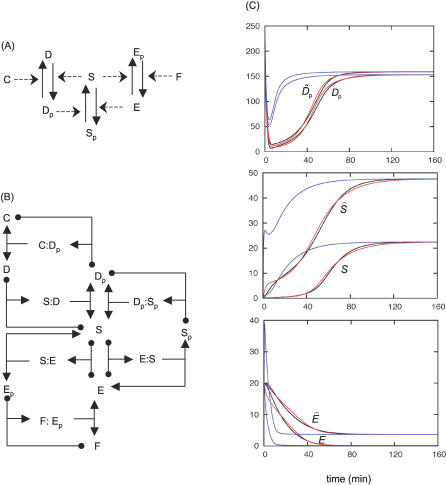
In metabolic networks, metabolites are usually present in great excess over the enzymes that catalyze their interconversion, and describing the rates of these reactions by using the Michaelis-Menten rate law is perfectly valid. This rate law assumes that the concentration of enzyme-substrate complex (C) is much less than the free substrate concentration (S0). However, in protein interaction networks, the enzymes and substrates are all proteins in comparable concentrations, and neglecting C with respect to S0 is not valid. Borghans, DeBoer, and Segel developed an alternative description of enzyme kinetics that is valid when C is comparable to S0. We extend this description, which Borghans et al. call the total quasi-steady state approximation, to networks of coupled enzymatic reactions. First, we analyze an isolated Goldbeter-Koshland switch when enzymes and substrates are present in comparable concentrations. Then, on the basis of a real example of the molecular network governing cell cycle progression, we couple two and three Goldbeter-Koshland switches together to study the effects of feedback in networks of protein kinases and phosphatases. Our analysis shows that the total quasi-steady state approximation provides an excellent kinetic formalism for protein interaction networks, because (1) it unveils the modular structure of the enzymatic reactions, (2) it suggests a simple algorithm to formulate correct kinetic equations, and (3) contrary to classical Michaelis-Menten kinetics, it succeeds in faithfully reproducing the dynamics of the network both qualitatively and quantitatively.


Conflict of interest statement

Competing interests. The authors have declared that no competing interests exist.

Figures

Figure 1
Figure 1. Goldbeter–Koshland Module
(A) Substrate S is phosphorylated by kinase E and dephosphorylated by phosphatase D. (B) Unpacked mechanism, including enzyme–substrate (E:S) complexes. The black dots at the tips of a T-shaped arrow indicate the two molecules that come together to form a complex, pointed to by the arrowhead; the dots are meant to indicate that enzyme–substrate binding is a reversible reaction. Formation of the product (E:S → E + P) is indicated by a T with two arrowheads (pointing to E and P); absence of a dot at the foot indicates that the catalytic step is presumed to be irreversible. (C) Steady state value of Ŝ p from Equation 8 is plotted against E T/D T for k 2d/k 2e = 1.7, K me = K md = 1 nM, S T = 50 nM, and for different values of D T: 0.5 nM (solid line), 5 nM (dashed line), and 50 nM (dotted line). (D) Same as (C), but using the exact steady state equations in Table 1 instead of using the Padé approximant. For D T = 5 nM, the exact steady state dependence is ultrasensitive, whereas the approximated dependence (C) is not.
Figure 2
Figure 2. Comparison of QSSA and tQSSA for the GK Module
The simulation shows the rise of S(t), starting from S(0) = 0, S p(0) = S T. Equations in Table 1, parameter values in Table 2. Both E and D are initially uncomplexed, E(0) = E T and D(0) = D T. (A) Exact solution (black line), QSSA solution (blue line). The arrows indicate the direction of time, whereas the distance between two consecutive dots on the lines is 1 min. (B) Exact solution (black), tQSSA solution (red). (C) Time evolution of the same simulation, with the same color scheme. The enzyme–substrate complexes in this simulation are not negligible. In particular, at steady state, E is almost completely bound to S, whereas at the beginning of the time course, D:Sp accounts for roughly half of all substrate molecules.
Figure 3
Figure 3. Mutual Antagonism between Two Kinases
(A) A simplified diagram shows all the actors of the network: two kinases S and E, and two phosphatases D and F. In grey, the additional reaction whereby Sp retains some catalytic activity. (B) The unpacked diagram, keeping track of all enzyme–substrate complexes. Diagram conventions as in Figure 1. (C) Upper panels: bifurcation diagrams for the exact model, equations in Table 3, parameter values in Table 2. Solid lines represent stable steady states; dashed lines are unstable steady states. When Sp has no catalytic activity, the system does not show hysteresis. Hysteresis is recovered if Sp has some residual activity—grey lines in (A) and (B). The background activity has the following parameter values: b1= 0.05 nM min−1, b−1= 0.005 min−1, and b2= 0.0001 min−1. (C) Lower panels: phase plane diagrams for the tQSSA model with S T=12. Ê nullcline (black), Ŝ nullcline (red), stable steady states (black dots), unstable steady state (white dot). Left: when Sp has some catalytic activity, the system is bistable. Right: when Sp has no catalytic activity, the system is monostable.
Figure 4
Figure 4. The Novak–Tyson Model for the G2/M Transition
(A) A simplified diagram shows all the actors of the network: two kinases S and E, and three phosphatases C, D, and F. (B) The unpacked diagram, keeping track of all enzyme–substrate complexes. Diagram conventions as in Figure 1. (C) The time course of the network shown in (B); equations in Table 4, parameter values in Table 2. Initial conditions: D p = 200 nM, S = 0, E = 20 nM, all complexes = 0. Again, QSSA (blue) performs poorly in reproducing the dynamics of the full system (black), whereas tQSSA (red) is a good approximation. Comparisons between D, S, and E and their counterparts D2, Ŝ, and Ê show that while the complexes forming D are not present in significant amounts, S contributes about one half of Ŝ, and E's contribution to Ê is negligible.
Figure 5
Figure 5. Timescale Separation in the Model of the G2/M Network
The exact solution (black lines) is compared with the QSSA, blue lines in (A), and to the tQSSA, red lines in B. Arrows indicate the direction of time, whereas the distance between consecutive dots on the lines is 1 min. Equations in Table 4, parameter values in Table 2.

Similar articles

Cited by

References

    1. Bray D. Protein molecules as computational elements in living cells. Nature. 1995;376:307–312. - PubMed
    1. Hartwell LH, Hopfield JJ, Leibler S, Murray AW. From molecular to modular cell biology. Nature. 1999;402:C47–C52. - PubMed
    1. Tyson JJ, Chen K, Novak B. Network dynamics and cell physiology. Nat Rev Mol Cell Biol. 2001;2:908–916. - PubMed
    1. Tyson JJ, Novak B, Odell GM, Chen K, Thron CD. Chemical kinetic theory: Understanding cell-cycle regulation. Trends Biochem Sci. 1996;21:89–96. - PubMed
    1. Segel LA. On the validity of the steady state assumption of enzyme kinetics. Bull Math Biol. 1988;50:579–593. - PubMed

Substances