. 2007 Mar;63(6):1629-39.
doi: 10.1111/j.1365-2958.2007.05617.x.

Domain swapping reveals that the C- and N-terminal domains of DnaG and DnaB, respectively, are functional homologues

Affiliations

Domain swapping reveals that the C- and N-terminal domains of DnaG and DnaB, respectively, are functional homologues

Kiran Chintakayala et al. Mol Microbiol. 2007 Mar.

Abstract

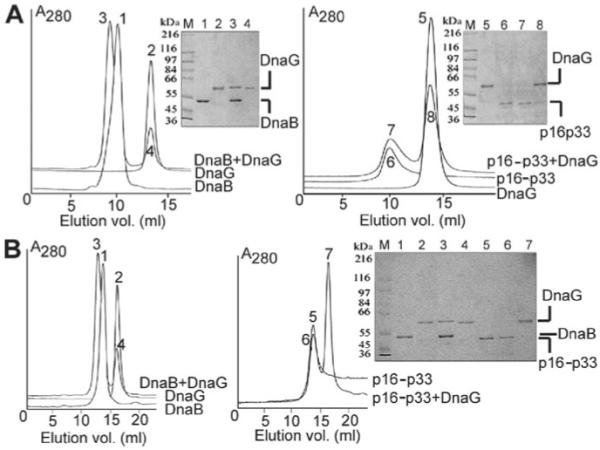
The bacterial primase (DnaG)-helicase (DnaB) interaction is mediated by the C-terminal domain of DnaG (p16) and a linker that joins the N- and C-terminal domains (p17 and p33 respectively) of DnaB. The crystal and nuclear magnetic resonance structures of p16 from Escherichia coli and Bacillus stearothermophilus DnaG proteins revealed a unique structural homology with p17, despite the lack of amino acid sequence similarity. The functional significance of this is not clear. Here, we have employed a 'domain swapping' approach to replace p17 with its structural homologue p16 to create chimeras. p33 alone hydrolyses ATP but exhibits no helicase activity. Fusing p16 (p16-p33) or DnaG (G-p33) to the N-terminus of p33 produced chimeras with partially restored helicase activities. Neither chimera interacted with DnaG. The p16-p33 chimera formed hexamers while G-p33 assembled into tetramers. Furthermore, G-p33 and DnaB formed mixed oligomers with ATPase activity better than that of the DnaB/DnaG complex and helicase activity better than the sum of the individual DnaB and G-p33 activities but worse than that of the DnaB/DnaG complex. Our combined data provide direct evidence that p16 and p17 are not only structural but also functional homologues, albeit their amino acid composition differences are likely to influence their precise roles.


Figures

Fig. 1
Fig. 1
G-p33 exhibits helicase activity. Time-courses of the helicase activity of G-p33 were compared with the activities of p33, DnaB and the DnaB/DnaG complex. The quantitative analysis of the data from these gels is shown in the graph below. No activity was detectable for p33 and therefore no plot is shown for p33. The inset in the graph shows an expanded view of the G-p33 and DnaB graphs for clarity. All reactions with single proteins were carried out with 37.5 nM (hexamers) of the appropriate protein (G-p33, p33 or DnaB). Mixing experiments were carried out with 37.5 nM (hexamers) DnaB in the presence of 675 nM (monomers) DnaG. C1 represents a G-p33 reaction for 30 min in the absence of ATP, while C2 represents an equivalent reaction in the absence of protein. Lanes labelled ‘a’ and ‘b’ show annealed and boiled controls respectively.
Fig. 2
Fig. 2
p16-p33 exhibits helicase activity. Fusing of the p16 domain to p33 has restored the helicase activity as shown in the top two graphs. Mixing p16-p33 with G-p33 shows an additive effect while mixing with DnaG shows no significant stimulation as that observed for the DnaB/DnaG complex in Fig. 1. Reactions with single proteins were carried out with 18.75 nM (hexamers) protein (p16-p33, G-p33 or p33). Mixing experiments were carried out with 18.75 nM (hexamers) in the presence of 675 nM (monomers) DnaG or 18.75 nM (hexamers) G-p33, as appropriate. Lanes labelled ‘a’ and ‘b’ show annealed and boiled controls respectively. C1 represents a p16-p33 reaction for 30 min in the absence of ATP. No activity was detectable for p33 and therefore no plot is shown for p33.
Fig. 3
Fig. 3
G-p33 mixing experiments. Time-courses of the helicase activity of G-p33 in the presence or absence of DnaB, p33 and DnaG, as indicated. Mixing G-p33 with DnaB caused only an additive effect, whereas mixing with DnaG or p33 did not affect the helicase activity of G-p33. Data from these gels were plotted in the left graph. DnaG exhibited no detectable helicase activity and therefore no graph is shown for DnaG. The right graph is an expansion of the four graphs squashed at the bottom of the left graph, for clarity. Reactions with single proteins were carried out with 18.75 nM (hexamers) G-p33 or DnaB and 675 nM (monomers) DnaG. Mixing reactions were carried out with 18.75 nM (hexamers) G-p33 in the presence of 18.75 nM (hexamers) DnaB or p33 or 675 nM (monomer) DnaG. Lanes a1 and b represent annealed and boiled controls, respectively, while a2 represents a 30 min control reaction with G-p33 in the absence of ATP.
Fig. 4
Fig. 4
G-p33 and p16-p33 do not form a stable complex with DnaG. A. The right panel shows a mixture of p16-p33 (969 nM hexamers) and DnaG (3.9 μM monomers) that was resolved through a Superdex S200 column and the elution profile compared with those of p16-p33 and DnaG alone. Samples from the peaks were analysed by SDS-PAGE. The left panel shows the same experiment carried out with DnaB and DnaG, for comparison. B. The same experiment described in A was carried out but this time using a Superose 6 column. For all the panels the arbitrary numbers on the peaks correspond to the same numbers of the lanes in the gel, as indicated. Molecular weight markers are shown in lane M.
Fig. 5
Fig. 5
DnaG does not stimulate the ATPase activity of G-p33 and p16-p33. The effect of DnaG on the ATPase activity of DnaB (A), p16-p33 (B) and G-p33 (C) was examined. DnaG stimulated the activity of DnaB but exhibited no effect on the chimeras. All reactions were carried out in triplicate with 30 nM DnaB, p16-p33 or G-p33 in the presence and absence of 90 nM DnaG. DnaG stimulates the activity of DnaB but not the activities of the chimeras.
Fig. 6
Fig. 6
A mixture of G-p33 (109.2 nM hexamers) and DnaB (464 nM hexamers) was separated through a Superose 6 gel filtration column. Two peaks were resolved. Samples from the peaks (labelled 3 and 4) were analysed by SDS-PAGE (lanes 3 and 4) and compared with control samples of DnaB (lane 1) and gp33 (lane 2). Both DnaB and G-p33 were present in the early peak indicating a mixed oligomer. Molecular weight markers are shown in lane M.
Fig. 7
Fig. 7
Analysis of stoichiometries by velocity ultracentrifugation using c(s,ffo) analysis. Contours are coloured from blue to red as the probability of a species with that combination of molecular weights/sedimentation coefficients increases. A. DnaB. Here DnaB exhibits predominately a hexameric oligomeric state. There is a trace of minor aggregate that skews the trace in the molecular weight axis; however, the predominate species still can be seen to be DnaB6. B. p16-p33. This is a single species and is clearly a hexamer. C. Gp33. The predominate species is tetrameric. Again, as in the case of DnaB, there is a trace of higher order aggregate that skews the trace along the molecular weight axis. However, again, the highest probability species is G-p334. D. DnaB + G-p33. Here the possible species free DnaB6 (301 966 kDa) and complexes G-p331–DnaB5 (354 191 kDa), G-p332–DnaB4 (404 524 kDa) and G-p332–DnaB10 (708 382 kDa) are marked.
Fig. 8
Fig. 8
Engineering of G-p33 and p16-p33 chimeras. A schematic diagram outlining the cloning steps involved in the engineering of the pET22b-dnaG-p33 and pET22b-p16-p33 vectors coding for the G-p33 and p16-p33 chimeras respectively. For a detailed explanation see Experimental procedures and Fig. S1.
Fig. 9
Fig. 9
All the proteins used in this study. A. A schematic diagram indicating the domain organization of DnaB and DnaG and the domain swapping carried out to construct three chimeras. The domain boundaries are indicated by amino acid numbers for the DnaB and DnaG proteins, as indicated (see also Supplementary material). B. SDS-PAGE analysis showing the purified proteins used in this study.

Similar articles

Cited by

References

    1. Bhattacharyya S, Griep MA. DnaB helicase affects the initiation specificity of E. coli primase on single-stranded DNA templates. Biochem. 2000;39:745–752. - PubMed
    1. Bird LE, Wigley DB. The B. stearothermophilus replicative helicase: cloning, overexpression and activity. Biochim Bioph Acta. 1999;1444:424–428. - PubMed
    1. Bird LE, Pan H, Soultanas P, Wigley DB. Mapping protein : protein interactions within a stable complex of DNA primase and DnaB helicase from B. stearothermophilus. Biochem. 2000;39:171–182. - PMC - PubMed
    1. Biswas SB, Chen PH, Biswas EE. Structure and function of E. coli DnaB protein: role of the N-terminal domain in helicase activity. Biochem. 1994;33:11307–11314. - PubMed
    1. Brown PH, Schuck P. Macromolecular size-and-shape distributions by sedimentation velocity analytical ultracentrifugation. Biophy J. 2006;20:4651–4661. - PMC - PubMed

Publication types

MeSH terms