

Differential expression of interferon responsive genes in rodent models of transmissible spongiform encephalopathy disease
- PMID: 17367538
- PMCID: PMC1847514
- DOI: 10.1186/1750-1326-2-5
Differential expression of interferon responsive genes in rodent models of transmissible spongiform encephalopathy disease
Abstract
Background: The pathological hallmarks of transmissible spongiform encephalopathy (TSE) diseases are the deposition of a misfolded form of a host-encoded protein (PrPres), marked astrocytosis, microglial activation and spongiosis. The development of powerful gene based technologies has permitted increased levels of pro-inflammatory cytokines to be demonstrated. However, due to the use of assays of differing sensitivities and typically the analysis of a single model system it remained unclear whether this was a general feature of these diseases or to what extent different model systems and routes of infection influenced the relative levels of expression. Similarly, it was not clear whether the elevated levels of cytokines observed in the brain were accompanied by similar increases in other tissues that accumulate PrPres, such as the spleen.
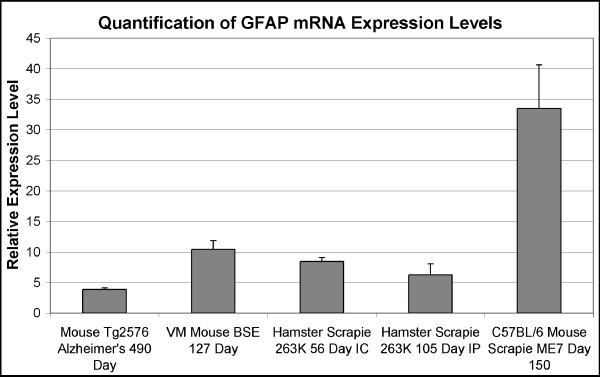
Results: The level of expression of the three interferon responsive genes, Eif2ak2, 2'5'-OAS, and Mx2, was measured in the brains of Syrian hamsters infected with scrapie 263K, VM mice infected with bovine spongiform encephalopathy and C57BL/6 mice infected with the scrapie strain ME7. Glial fibrillary acidic expression confirmed the occurrence of astrocytosis in all models. When infected intracranially all three models showed a similar pattern of increased expression of the interferon responsive genes at the onset of clinical symptoms. At the terminal stage of the disease the level and pattern of expression of the three genes was mostly unchanged in the mouse models. In contrast, in hamsters infected by either the intracranial or intraperitoneal routes, both the level of expression and the expression of the three genes relative to one another was altered. Increased interferon responsive gene expression was not observed in a transgenic mouse model of Alzheimer's disease or the spleens of C57BL/6 mice infected with ME7. Concurrent increases in TNFalpha, TNFR1, Fas/ApoI receptor, and caspase 8 expression in ME7 infected C57BL/6 mice were observed.
Conclusion: The identification of increased interferon responsive gene expression in the brains of three rodent models of TSE disease at two different stages of disease progression suggest that this may be a general feature of the disease in rodents. In addition, it was determined that the increased interferon responsive gene expression was confined to the CNS and that the TSE model system and the route of infection influenced the pattern and extent of the increased expression. The concurrent increase in initiators of Eif2ak2 mediated apoptotic pathways in C57BL/6 mice infected with ME7 suggested one mechanism by which increased interferon responsive gene expression may enhance disease progression.
Figures


Similar articles
-
Identification of up-regulated genes by array analysis in scrapie-infected mouse brains.Neuropathol Appl Neurobiol. 2004 Oct;30(5):555-67. doi: 10.1111/j.1365-2990.2004.00565.x. Neuropathol Appl Neurobiol. 2004. PMID: 15488032
-
Transcriptome analysis reveals altered cholesterol metabolism during the neurodegeneration in mouse scrapie model.J Neurochem. 2007 Aug;102(3):834-47. doi: 10.1111/j.1471-4159.2007.04566.x. Epub 2007 Apr 16. J Neurochem. 2007. PMID: 17437544
-
Aquaporin 1 and aquaporin 4 overexpression in bovine spongiform encephalopathy in a transgenic murine model and in cattle field cases.Brain Res. 2007 Oct 17;1175:96-106. doi: 10.1016/j.brainres.2007.06.088. Epub 2007 Jul 27. Brain Res. 2007. PMID: 17868659
-
Genomic analysis of response to traumatic brain injury in a mouse model of Alzheimer's disease (APPsw).Brain Res. 2007 Dec 14;1185:45-58. doi: 10.1016/j.brainres.2007.09.042. Epub 2007 Sep 25. Brain Res. 2007. PMID: 17961517
-
Semen from scrapie-infected rams does not transmit prion infection to transgenic mice.Reproduction. 2008 Mar;135(3):415-8. doi: 10.1530/REP-07-0388. Reproduction. 2008. PMID: 18299435
Cited by
-
Changes in protein structure and distribution observed at pre-clinical stages of scrapie pathogenesis.Biochim Biophys Acta. 2008 Oct;1782(10):559-65. doi: 10.1016/j.bbadis.2008.06.004. Epub 2008 Jun 14. Biochim Biophys Acta. 2008. PMID: 18625306 Free PMC article.
-
Type I interferon protects neurons from prions in in vivo models.Brain. 2019 Apr 1;142(4):1035-1050. doi: 10.1093/brain/awz016. Brain. 2019. PMID: 30753318 Free PMC article.
-
The hepatitis C virus non-structural NS5A protein impairs both the innate and adaptive hepatic immune response in vivo.J Biol Chem. 2009 Oct 9;284(41):28343-28351. doi: 10.1074/jbc.M109.038877. Epub 2009 Aug 12. J Biol Chem. 2009. PMID: 19674968 Free PMC article.
-
Loss of prion protein induces a primed state of type I interferon-responsive genes.PLoS One. 2017 Jun 26;12(6):e0179881. doi: 10.1371/journal.pone.0179881. eCollection 2017. PLoS One. 2017. PMID: 28651013 Free PMC article.
-
Systemic challenge with the TLR3 agonist poly I:C induces amplified IFNalpha/beta and IL-1beta responses in the diseased brain and exacerbates chronic neurodegeneration.Brain Behav Immun. 2010 Aug;24(6):996-1007. doi: 10.1016/j.bbi.2010.04.004. Epub 2010 Apr 23. Brain Behav Immun. 2010. PMID: 20399848 Free PMC article.
References
LinkOut - more resources
Full Text Sources
Research Materials
Miscellaneous
