. 2007 Apr 25;146(1):286-97.
doi: 10.1016/j.neuroscience.2006.12.071. Epub 2007 Mar 23.

Distribution of serotonin 5-HT2C receptors in the ventral tegmental area

Affiliations

Distribution of serotonin 5-HT2C receptors in the ventral tegmental area

M J Bubar et al. Neuroscience. .

Abstract

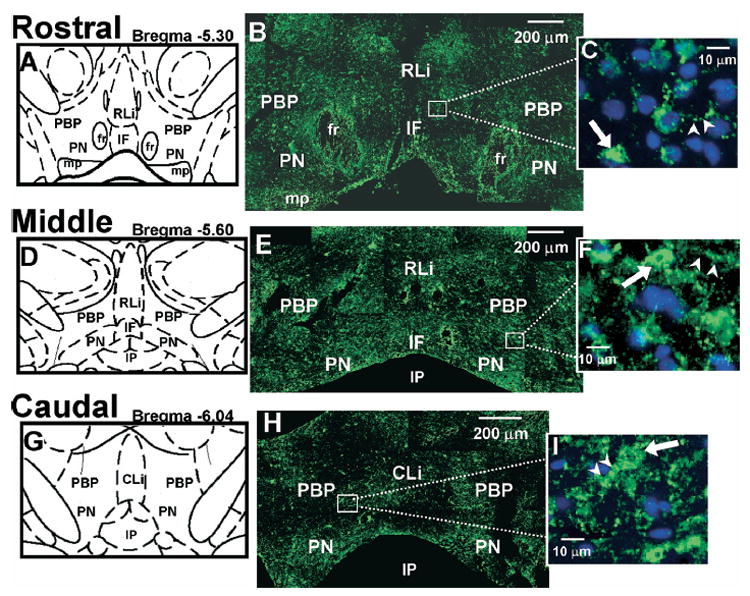
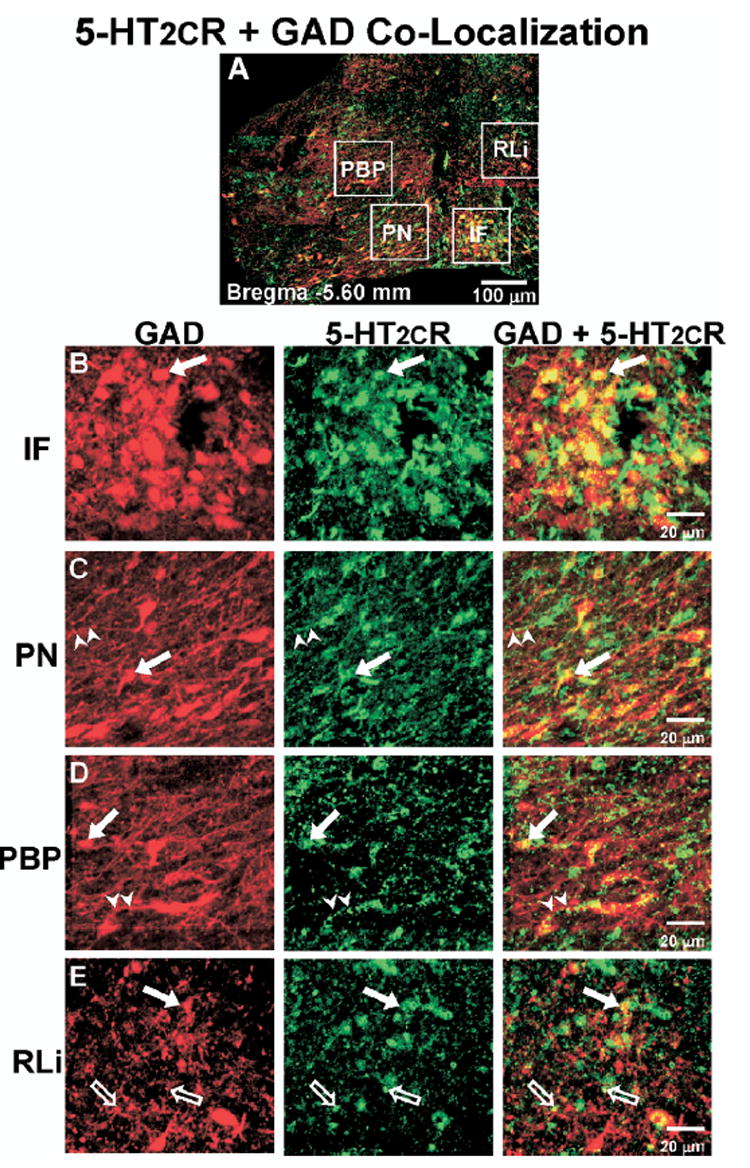
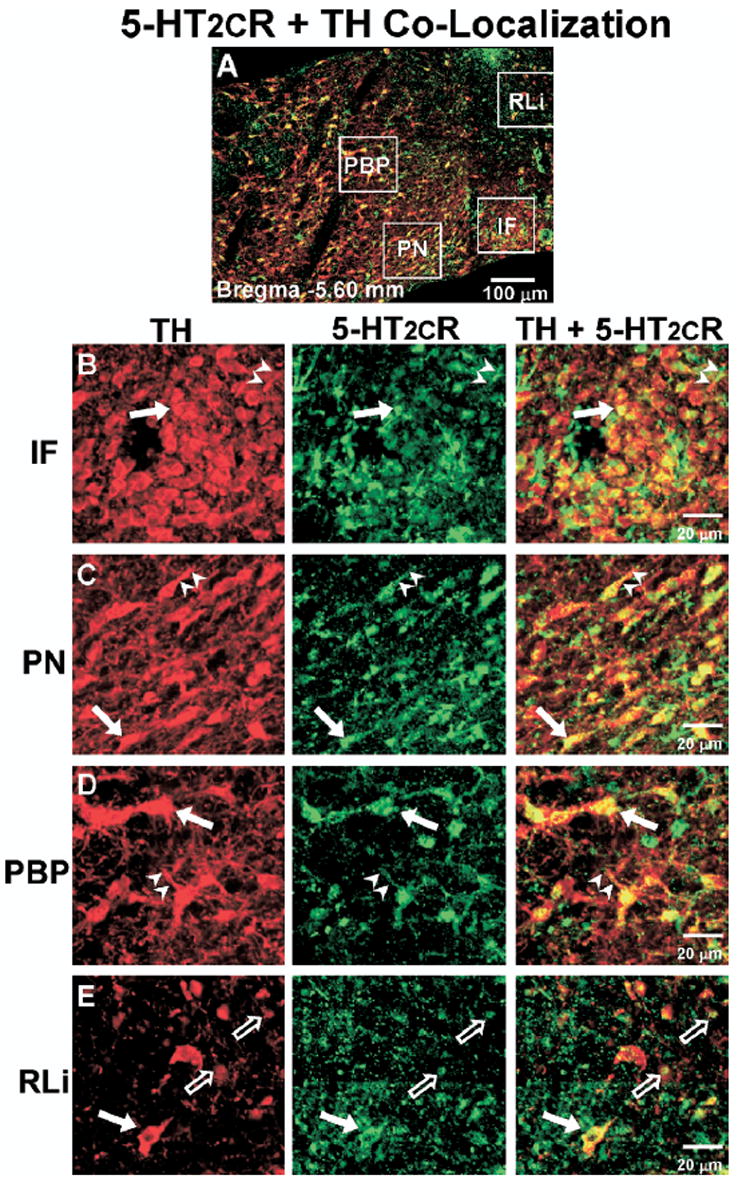
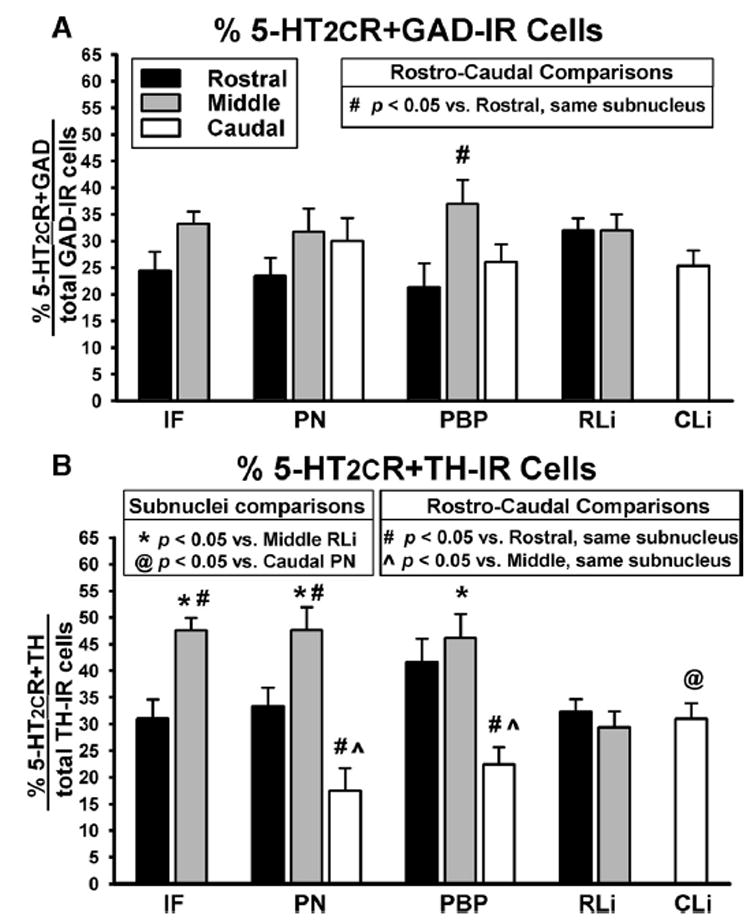
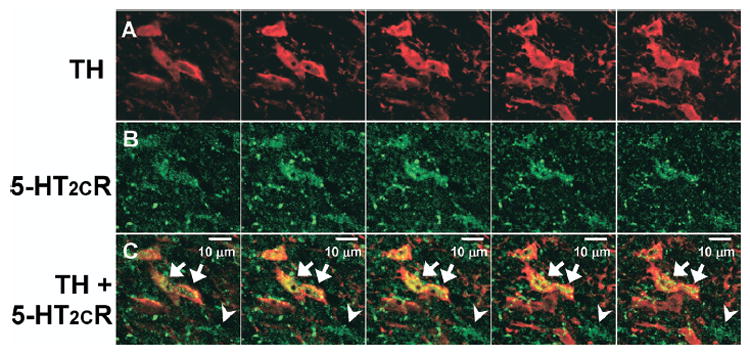
Serotonin 2C receptors (5-HT2CR) appear to exert tonic inhibitory influence over dopamine (DA) neurotransmission in the ventral tegmental area (VTA), the origin of the mesolimbic DA system, thought to be important in psychiatric disorders including addiction and schizophrenia. Current literature suggests that the inhibitory influence of 5-HT2CR on DA neurotransmission occurs via indirect activation of GABA inhibitory neurons, rather than via a direct action of 5-HT2CR on DA neurons. The present experiments were performed to establish the distribution of 5-HT2CR protein on DA and GABA neurons in the VTA of male rats via double-label immunofluorescence techniques. The 5-HT2CR protein was found to be co-localized with the GABA synthetic enzyme glutamic acid decarboxylase (GAD), confirming the presence of the 5-HT2CR on GABA neurons within the VTA. The 5-HT2CR immunoreactivity was also present in cells that contained immunoreactivity for tyrosine hydroxylase (TH), the DA synthetic enzyme, validating the localization of 5-HT2CR to DA neurons in the VTA. While the degree of 5-HT2CR+GAD co-localization was similar across the rostro-caudal levels of VTA subnuclei, 5-HT2CR+TH co-localization was highest in the middle relative to rostral and caudal levels of the VTA, particularly in the paranigral, parabrachial, and interfascicular subnuclei. The present results suggest that the inhibitory influence of the 5-HT2CR over DA neurotransmission in the VTA is a multifaceted and complex interplay of 5-HT2CR control of the output of both GABA and DA neurons within this region.


Figures

Fig. 1
Fig. 1
5-HT2CR IR in the VTA. (A, D, G) Schematic diagrams of the VTA subnuclei at rostral (Bregma −5.30 mm; A), middle (Bregma −5.60 mm; D), and caudal (Bregma −6.04 mm; G) levels of the VTA. (B, E, H) Representative composite photomicrographs displaying 5-HT2CR IR (green) in rostral (B), middle (E) and caudal (H) levels of the VTA. (C, F, I) High magnification photographs of the boxed area in panels B, E, and H, respectively. DAPI-labeled nuclei are shown in blue. ➡, Examples of 5-HT2CR-IR cell bodies (green); ➤, potential 5-HT2CR-IR neuronal processes (green). Scale bars=200 μm (B, E, H); 10 μm (C, F, I). The five VTA subnuclei include: PBP, PN, IF, RLi, CLi. The location of the fasciculus retroflexus (fr), interpeduncular nucleus (IP), and mammillary peduncle (mp) is labeled for orientation purposes.
Fig. 2
Fig. 2
Co-localization of 5-HT2CR+GAD IR in the middle VTA. (A) Representative composite photomicrograph of the middle level of the VTA (Bregma −5.60 mm) displaying the overlay of GAD-IR (red) and 5-HT2CR-IR (green); cells containing IR for both GAD and 5-HT2CR appear yellow. (B–E) High magnification images of boxed areas in panel A, representing the various VTA subnuclei (see Fig. 1 for abbreviations). Left column, GAD-IR (red); middle column, 5-HT2CR-IR (green); right column, overlay of images to demonstrate GAD and 5-HT2CR co-localization (yellow). ➡, Indicate cell bodies containing both GAD and 5-HT2CR-IR; ➤, co-labeled neuronal processes; ➱, potential terminal boutons. Scale bars=100 μm (A); 20 μm (B–E).
Fig. 3
Fig. 3
Co-localization of 5-HT2CR+TH IR in the middle VTA. (A) Representative composite photomicrograph of the middle level of the VTA (Bregma −5.60 mm) displaying the overlay of TH-IR (red) and 5-HT2CR-IR (green); cells containing IR for both TH and 5-HT2CR appear yellow. (B–E) High magnification images of boxed areas in panel A, representing the various VTA subnuclei (see Fig. 1 for abbreviations). Left column, TH-IR (red); middle column, 5-HT2CR-IR (green); right column, overlay of images to demonstrate TH and 5-HT2CR co-localization (yellow). ➡, Indicate cell bodies containing both TH and 5-HT2CR-IR; ➤, co-labeled neuronal processes; ➱, potential terminal boutons. Scale bars=100 μm (A); 20 μm (B–E).
Fig. 4
Fig. 4
Percentage of 5-HT2CR+GAD and 5-HT2CR+TH co-localized cells in the various VTA subnuclei. Data represent the mean (±S.E.M.; n=7–12/group) percentage of (A) 5-HT2CR+GAD co-localized cells and (B) 5-HT2CR+TH co-localized cells in the rostral (black bars), middle (gray bars) and caudal (white bars) levels of the VTA subnuclei. Data were calculated by dividing the % of co-labeled cells by the total number of GAD- or TH-labeled cells, respectively, in each subnucleus for each VTA tissue section. Resultant values were averaged for the rostral, middle and caudal levels of each subnucleus. For analyses comparing the expression of co-localization among the different rostro-caudal levels of each subnucleus: # P<0.05 compared with the rostral level of the same subnucleus; P<0.05 vs. middle level of the same subnucleus. For analyses comparing the expression of co-localization between the various subnuclei for each rostro-caudal level: * P<0.05 vs. middle RLi; @ P<0.05 vs. caudal PN.
Fig. 5
Fig. 5
Co-localization of TH and 5-HT2CR IR. Series of five sequential photomicrographs (from left to right) captured using a confocal microscope displaying TH (A; red) and 5-HT2CR (B; green) IR in the VTA. (C) Overlay of images in A and B shows co-localization of TH+5-HT2CR IR (yellow) as indicated by arrows. Arrowheads point to a 5-HT2CR-IR cell that is devoid of TH-IR. Scale bar=10 μm.

References

    1. Abramowski D, Rigo M, Duc D, Hoyer D, Staufenbiel M. Localization of the 5-hydroxytryptamine2C receptor protein in human and rat brain using specific antisera. Neuropharmacology. 1995;34:1635–1645. - PubMed
    1. Bankson MG, Yamamoto BK. Serotonin-GABA interactions modulate MDMA-induced mesolimbic dopamine release. J Neurochem. 2004;91:852–859. - PubMed
    1. Bubar MJ, Cunningham KA. Serotonin 5-HT2A and 5-HT2C receptors as potential targets for modulation of psychostimulant use and dependence. Curr Top Med Chem. 2006;6:1971–1985. - PubMed
    1. Bubar MJ, Seitz PK, Thomas ML, Cunningham KA. Validation of a selective serotonin 5-HT(2C) receptor antibody for utilization in fluorescence immunohistochemistry studies. Brain Res. 2005;1063:105–113. - PubMed
    1. Cai L, Friedman N, Xie XS. Stochastic protein expression in individual cells at the single molecule level. Nature. 2006;440:358–362. - PubMed

Publication types

MeSH terms

Substances