. 2007 May 25:1147:105-23.
doi: 10.1016/j.brainres.2007.02.006. Epub 2007 Feb 8.

Influence of norepinephrine on somatosensory neuronal responses in the rat thalamus: a combined modeling and in vivo multi-channel, multi-neuron recording study

Affiliations

Influence of norepinephrine on somatosensory neuronal responses in the rat thalamus: a combined modeling and in vivo multi-channel, multi-neuron recording study

Karen A Moxon et al. Brain Res. .

Abstract

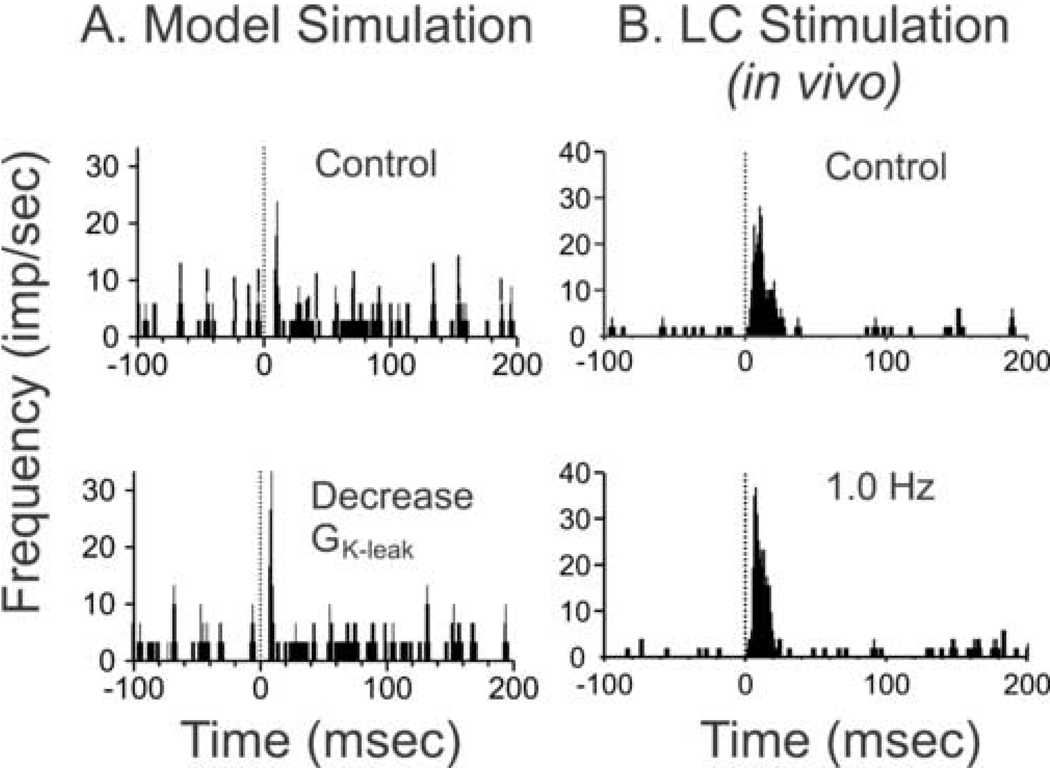
Norepinephrine released within primary sensory circuits from locus coeruleus afferent fibers can produce a spectrum of modulatory actions on spontaneous or sensory-evoked activity of individual neurons. Within the ventral posterior medial thalamus, membrane currents modulated by norepinephrine have been identified. However, the relationship between the cellular effects of norepinephrine and the impact of norepinephrine release on populations of neurons encoding sensory signals is still open to question. To address this lacuna in understanding the net impact of the noradrenergic system on sensory signal processing, a computational model of the rat trigeminal somatosensory thalamus was generated. The effects of independent manipulation of different cellular actions of norepinephrine on simulated afferent input to the computational model were then examined. The results of these simulations aided in the design of in vivo neural ensemble recording experiments where sensory-driven responses of thalamic neurons were measured before and during locus coeruleus activation in waking animals. Together the simulated and experimental results reveal several key insights regarding the regulation of neural network operation by norepinephrine including: 1) cell-specific modulatory actions of norepinephrine, 2) mechanisms of norepinephrine action that can improve the tuning of the network and increase the signal-to-noise ratio of cellular responses in order to enhance network representation of salient stimulus features and 3) identification of the dynamic range of thalamic neuron function through which norepinephrine operates.


Figures

Figure 1
Figure 1
Membrane current models for each cell. The soma had a leak current, Gleak, that consists of a sodium and potassium current. This current was responsible for maintaining the resting membrane potential. There was a voltage dependent potassium current, GK1 which acted as a delayed rectifier. The low threshold calcium current, GT, was responsible for the internal oscillations and GH was a hyperpolarizing activated cation current. Neither GT nor GH (shaded grey) were explicitly modeled (refer to text). GK2 was a second voltage dependent potassium current with a longer time constant and was responsible for the between burst after-hyperpolarization. The dendritic currents include a calcum current GCa and a calcium dependent potassium current GK[Ca].
Figure 2
Figure 2
Effects of simulated NE actions and LC activation on sensory thalamic neuronal responsiveness to synaptic input. Post-stimulus time histograms (PSTHs) were used to measure the responses of single cells to simulation or physiological activation of afferent inputs. A.) In the model the magnitude and modal latency of the response to simulated single whisker stimulation were measured at the peak of the largest bin post-stimulus. Under initial (control) model conditions, the network approximated the state of an awake but quietly resting animal (i.e. absence of sleep spindles and low probability of activation of the low threshold calcium current). When single whisker stimulation was simulated under this initial condition, the peak response was 243 Hz at a modal latency of 7 ms post-stimulus (above). As “simulated NE” was added to the model, the leaky potassium current was reduced and the resting membrane potential increased to −45.3 mV. When single whisker stimulation was simulated under this ‘NE-activated’ condition, the peak response was 324 Hz (133% increase) at a modal latency of 5 ms post stimulus (below). B.) In the intact, quietly resting, awake rat VPM thalamic neuron responses to whisker pad electrical stimulation were recorded before (control - above) and during tonic (1.0 Hz - below) activation of the ipsilateral LC nucleus. In the case shown each histogram represents the neuronal discharge pattern generated during n=30 whisker stimulus presentations (stimulus onset = 0). For this cell whisker-evoked discharge was enhanced 31% above control levels (28.1 to 36.8 Hz) during LC stimulation and demonstrated a 22% decrease in modal latency (11.3 ms to 8.8 ms).
Figure 3
Figure 3
NE modulation of GK Leak. To better understand the complex nature of the response of the VPM/nRT network to simulated activation of NE postsynaptic mechanisms, phase diagrams were used to explore the working space that defines the response domains of individual cells to simulated activation of NE. X-axis equals the percent decrease in GK-leak conductance in the nRT and the y-axis equals the percent decrease in GK-leak conductance in the VPM. The effect of activating NE receptors in the VPM and the nRT were independently modulated by varying the model parameter GKleak (refer to Figure 1 for an explanation). The effect of increasing NE activation was to decrease Ileak and thereby depolarize the cell’s resting membrane potential. Simulating an increase in NE activation in VPM but not nRT (x-axis at 0) initially caused no change in the response to simulated single whisker stimulation. However, as the Ileak current was halved (y-axis approximately 50%) the responsiveness of VPM cells to simulated sensory input, as measured by the PSTH, decreased. When NE activation was further increased the responsiveness of VPM cells increased compared to baseline conditions. As NE action was moderately increased in both populations (i.e. both x and y axes at about 50%), cells responded with an increased probability of discharge and sometimes a decreased modal latency. However, for large increases in NE action in both populations (x and y axes greater than 75%) the probability of cell responses decreased. Changes stated within the diagram are for the majority of cells. Refer to Table 1 for details on the distribution of responses throughout the network. B) Illustrative PSTHs demonstrate the representative cases from each area of the phase space. PSTH notations are the same as Figure 2A.
Figure 4
Figure 4
NE Modulation of PSP Amplitude. The diagram shown here illustrates the effects of changing excitatory and inhibitory synaptic efficacies in VPM and nRT cells. The X-axis indicates increasing amplitude of the IPSP and the y-axis indicates increasing amplitude of the EPSP. The net effect of changing PSP amplitudes was similar to the effects observed by altering the leak current. However, a much larger operating region, resulting in increased responsiveness and decreased modal latency of VPM cells, was observed with alteration of PSP amplitudes. Although increasing the amplitude of the EPSPs alone did not change the responsiveness of VPM cells to simulated sensory input (x-axis = 1.0), concomitant moderate increases in IPSP amplitude yielded increases in the amplitude of the response and decreases in modal latency (x-axis = 2.0). If both the EPSP amplitude and the IPSP amplitude were tripled, the responsiveness of VPM cells decreased. Changes stated within the diagram are for the majority of cells. Refer to Table 2 for details on the distribution of responses throughout the network. B) Example PSTHs illustrate representative modeled effects within PSP amplitude phase space. PSTH notations are the same as Figure 2A.
Figure 5
Figure 5
Modulation of thalamic neuron responsiveness to excitatory synaptic input across a range of tonic LC output. PSTH’s illustrate the bi-phasic (inverted-U) response relationship observed for LC-mediated modulation of the response of a single VPM thalamic neuron to whisker pad electrical stimulation. Each histogram sums unit activity during an equivalent number of whisker pad stimulus presentations. Data were collected during control and tonic ipsilateral LC stimulation periods (0.5, 1.0, 5.0 Hz; 10 uA). For this cell, peak enhancement (above Control) of whisker-evoked discharge was observed at 0.5 Hz LC stimulation. Higher frequencies (1.0, 5.0 Hz) of LC tonic stimulation also enhanced, but to a lesser degree, the whisker evoked excitatory response of the cell.
Figure 6
Figure 6
LC-noradrenergic pathway modulation of sensory thalamic neuron responsiveness. Poststimulus time histograms (PSTH’s) histograms illustrate the effects of increasing tonic frequencies of locus coeruleus (LC) electrical stimulation on whisker-evoked responses of simultaneously recorded VPM thalamic neurons. Spike train activity for individual cells was recorded from an awake rat before (control) and during tonic activation (0.5, 1.0, or 5.0 Hz at 10 uA) of the ipsilateral LC nucleus. Each histogram represents the neuronal discharge pattern generated during n=30 whisker stimulus presentations (stimulus onset = 0). A. In some cells (top row) an increasing range of tonic activation of LC produced a monotonic suppression of whisker-evoked discharge. B. In other cells (middle row) whisker-evoked discharge was progressively enhanced across the range of stimulus frequencies tested. C. However, in many cells (bottom row) stimulus-evoked responses were enhanced at low LC stimulation frequencies (0.5–1.0 Hz) and suppressed at higher stimulus frequencies (5.0 Hz), yielding an inverted-U response function for LC-induced modulatory actions in these neurons. Thus, both facilitation and suppression of responsiveness to synaptic input can be observed simultaneously in neighboring thalamic neurons with increased tonic output from the LC. Inset numbers represent the summed probability that the neuron will discharge in response to the whisker pad stimulation.

References

    1. Aston-Jones G, Bloom FE. Activity of norepinephrine-containing locus coeruleus neurons in behaving rats anticipates fluctuations in the sleep-waking cycle. J. Neurosci. 1981a;1:876–886. - PMC - PubMed
    1. Aston-Jones G, Bloom FE. Norepinephrine-containing locus coeruleus neurons in behaving rats exhibit pronounced responses to non-noxious environmental stimuli. J. Neurosci. 1981b;1:887–900. - PMC - PubMed
    1. Akaike T. Periodic bursting activities of locus coerulleus neurons in the rat. Brain Res. 1982;239:629–633. - PubMed
    1. Bal T, McCormick DA. What stops synchronized thalamocortical oscillations? Neuron. 1996;17:297–308. - PubMed
    1. Bazhenov M, Timofeev I, Steriade M, Sejnowski T. Spiking-bursting activity in the thalamic reticular nucleus initiates sequences of spindle oscillations in thalamic networks. J Neurophysiol. 2000;84:1076–1087. - PubMed

Publication types