. 2007 May;205(1):116-31.
doi: 10.1016/j.expneurol.2007.01.035. Epub 2007 Feb 12.

Detection of traumatic axonal injury with diffusion tensor imaging in a mouse model of traumatic brain injury

Affiliations

Detection of traumatic axonal injury with diffusion tensor imaging in a mouse model of traumatic brain injury

C L Mac Donald et al. Exp Neurol. 2007 May.

Abstract

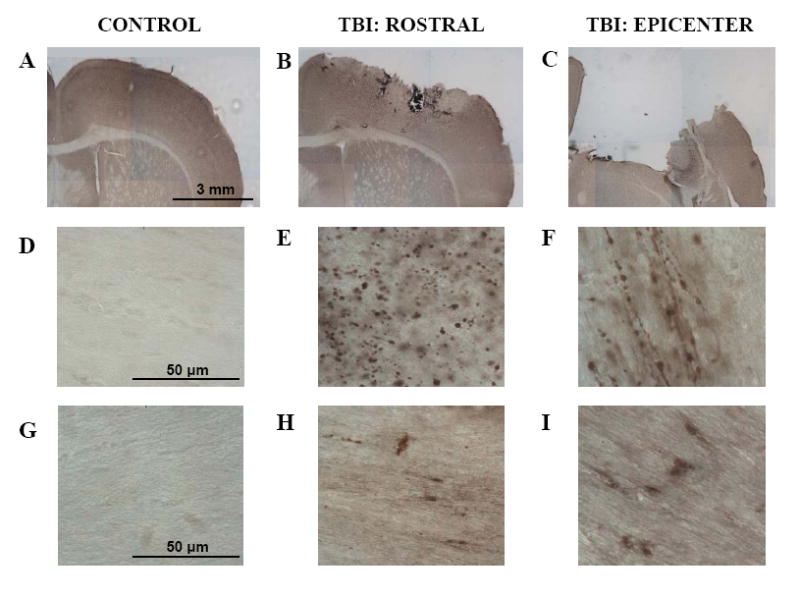
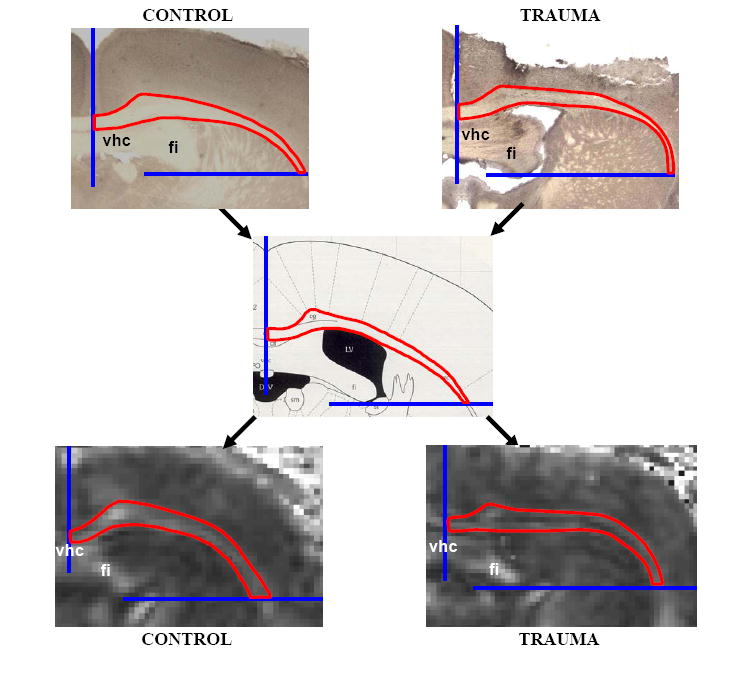
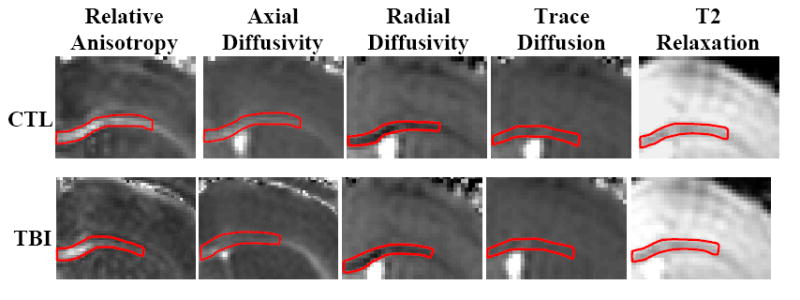
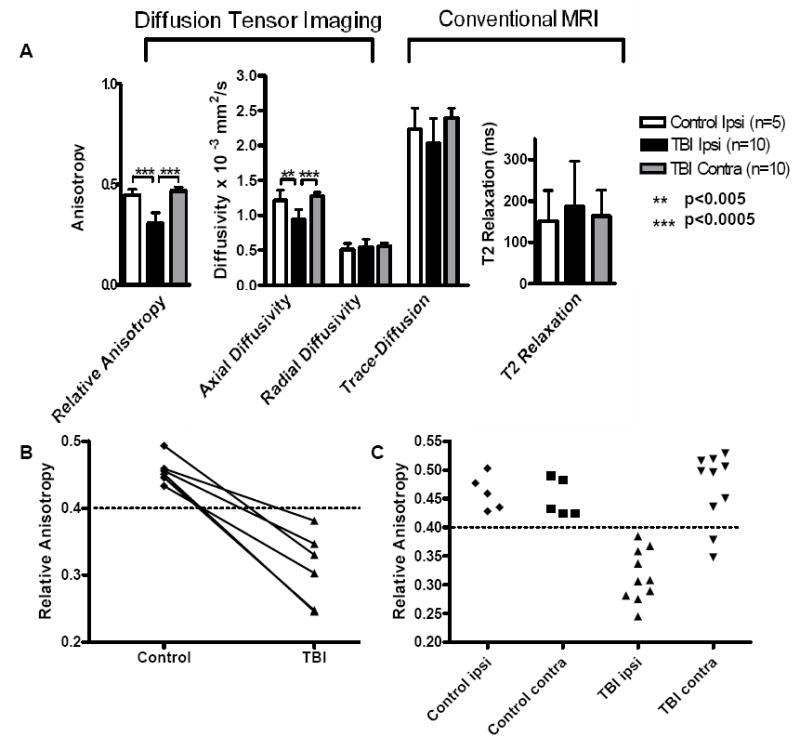
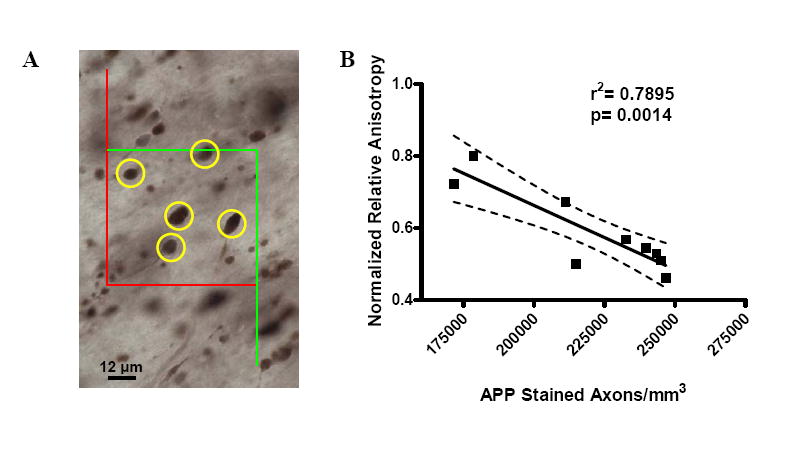
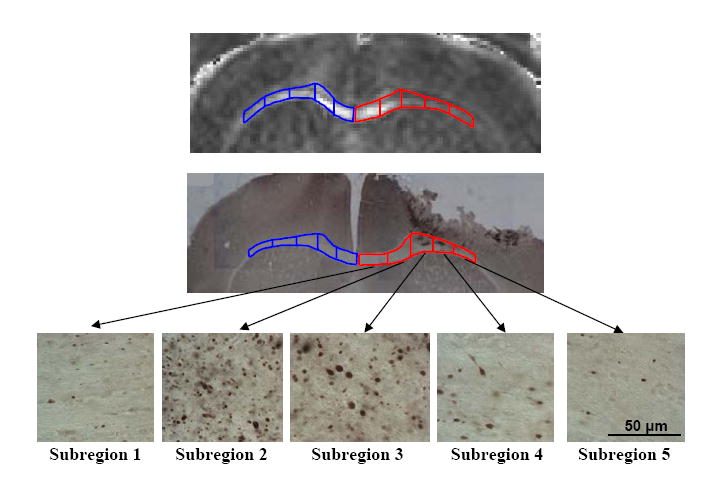
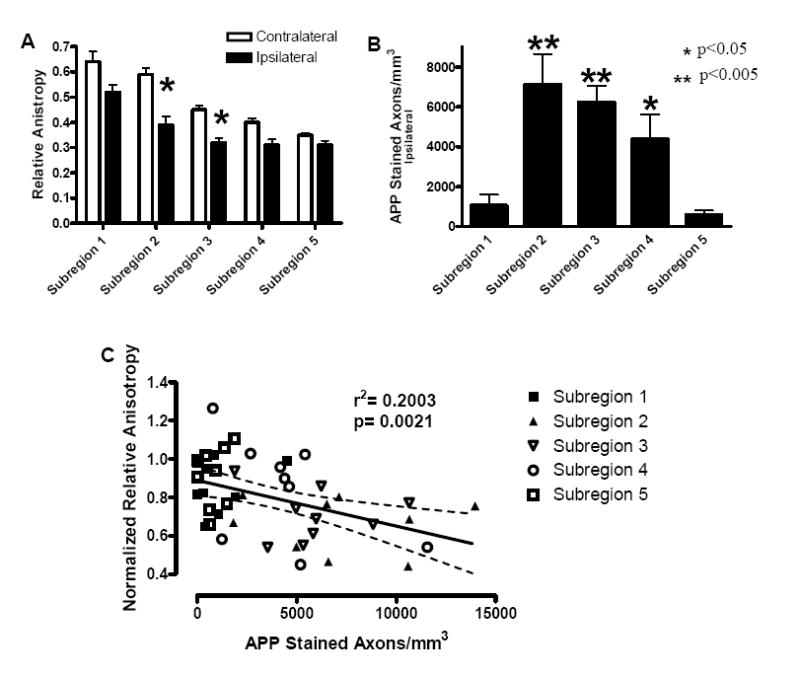
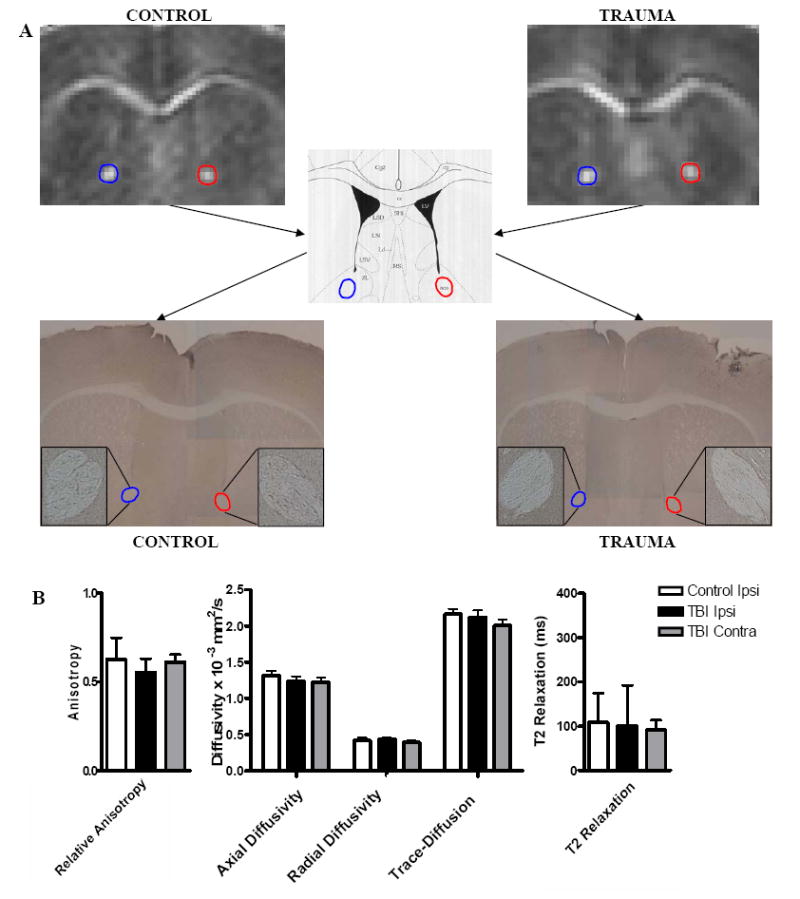
Traumatic axonal injury (TAI) is thought to be a major contributor to cognitive dysfunction following traumatic brain injury (TBI), however TAI is difficult to diagnose or characterize non-invasively. Diffusion tensor imaging (DTI) has shown promise in detecting TAI, but direct comparison to histologically-confirmed axonal injury has not been performed. In the current study, mice were imaged with DTI, subjected to a moderate cortical controlled impact injury, and re-imaged 4-6 h and 24 h post-injury. Axonal injury was detected by amyloid beta precursor protein (APP) and neurofilament immunohistochemistry in pericontusional white matter tracts. The severity of axonal injury was quantified using stereological methods from APP stained histological sections. Two DTI parameters--axial diffusivity and relative anisotropy--were significantly reduced in the injured, pericontusional corpus callosum and external capsule, while no significant changes were seen with conventional MRI in these regions. The contusion was easily detectable on all MRI sequences. Significant correlations were found between changes in relative anisotropy and the density of APP stained axons across mice and across subregions spanning the spatial gradient of injury. The predictive value of DTI was tested using a region with DTI changes (hippocampal commissure) and a region without DTI changes (anterior commissure). Consistent with DTI predictions, there was histological detection of axonal injury in the hippocampal commissure and none in the anterior commissure. These results demonstrate that DTI is able to detect axonal injury, and support the hypothesis that DTI may be more sensitive than conventional imaging methods for this purpose.


Figures

Figure 1
Figure 1. Axonal injury Following Experimental Controlled Cortical Impact TBI
APP immunohistochemistry (A-F) (A,D) Uninjured tissue shows no APP staining in white matter. (B,E) At 24 hrs post-injury there were numerous APP stained axonal varicosities in the corpus callosum rostral to the epicenter of injury. (C,F) At the epicenter of injury, there is significant tissue loss and APP stained varicosities in the remaining white matter at the edges of the contusion. Many had the characteristic “beads on a string” appearance of injured axons running parallel to the plane of the section. Neurofilament immunohistochemistry (G-I). (G) Uninjured tissue shows no neurofilament light chain immunostaining in corpus callosum. (H) Neurofilament staining rostral to the epicenter within the corpus callosum. (I) In remaining white matter surrounding the epicenter, areas of neurofilament staining were also present.
Figure 2
Figure 2. Definition of Regions of Interest Containing Histologically Verified Axonal Injury
A region of interest within the corpus callosum and external capsule containing APP stained axons was described. Boundaries were noted for these regions and these boundaries used for quantitative analysis of the DTI image sets. In the example shown, the midline was used as one boundary and a horizontal line extending laterally from the inferior edge of the fimbria was used as the other boundary. Similar boundaries for nine rostral to caudal sections were applied to the DTI data sets for quantitative analysis. (vhc: ventral hippocampal commissure, fi: fimbria). Center panel adopted from Franklin 1997.
Figure 3
Figure 3. MRI Signal Characteristics in Control and Trauma Groups
Grey scale images of signal intensity: lighter shading indicates elevated signal (i.e. increased anisotropy, greater diffusivity, or longer relaxation time). The region of interest in each panel is outlined in red. Relative anisotropy and axial diffusivity show a gradient of signal changes within the ROI on post-TBI images. Radial diffusivity, trace, and T2 images show homogeneous signal throughout the region of interest that is similar to that of the control images. Examples shown for illustrative purposes, not necessarily from the same mouse. (Bregma +0.26 mm, Franklin 1997)
Figure 4
Figure 4. Quantitative Analysis of MR Imaging Parameters
(A) Average values for DTI and conventional MRI parameters within the region of interest encompassing injured white matter in corpus callosum and external capsule. Differences between ipsilateral TBI and ipsilateral control for relative anisotropy (RA) and axial diffusivity (AD) were statistically significant (p=0.00001 RA, p=0.005 AD, one-sided, paired T-tests) whereas there were no difference for radial diffusivity (RD) (p=0.874), DWI-trace (p=0.273), and T2 relaxation (p=0.797). Differences between the ipsilateral and contralateral sides of the TBI groups were also significant for RA (p=0.00002) and AD (p=0.000035). Error bars denote standard deviations. (B) Graph of RA values acquired for mice scanned before and after TBI. There was a decreasing trend in RA for each mouse postinjury. (C) Scatter plots of RA values from each mouse. There was no overlap of RA values between injured and control ROI’s ipsilateral to the injury. No differences between ipsilateral and contralateral values were seen in controls. RA in the contralateral ROI’s after TBI overall was similar to control, with the exception of data from 2 mice. Upon histological re-examination these two brains were found to have some contralateral axonal injury.
Figure 5
Figure 5. Quantitative Relationship Between DTI Signal Changes and Histologically Defined Axonal Injury Severity
(A). Counting frame used for stereological estimation of the numbers of APP stained, injured axons. APP stained axonal varicosities (marked in yellow) within the computer-generated, systematic random sampling zones were counted. Positively stained injured axonal varicosities were not counted if they touched the red boundary and were counted if they were centered within the green boundary. Faintly stained punctae less than 8 μm in diameter were not counted. (B) Correlation of normalized relative anisotropy with the estimated numbers of APP-stained, injured axons per mm3. Each symbol represents 1 mouse. The values of RA acquired following trauma were normalized by dividing by the mean ipsilateral RA value acquired during the control scans. Estimates of the number of APP-stained axons per mm3 were obtained by dividing the total number of counted APP-stained axonal varicosities by the total volume of the counted sampling zones. A strong correlation was found between the change in relative anisotropy and the severity of axonal injury as defined by APP immunostaining. Dashed lines represent the 95% confidence band.
Figure 6
Figure 6. Spatial Gradient of DTI Signal Change and Histologically-Defined Axonal Injury
Top: DTI image showing a spatial gradient of RA signal change in injured corpus callosum (right; subregions outlined in red) and equivalent subregions of uninjured contralateral corpus callosum (left; subregions outlined in blue). The ipsilateral side shows a marked decrease in RA signal relative to the contralateral side in several subregions. The contralateral side shows very high RA values medially and lower, though still elevated, RA values more laterally. Middle: APP stained histological section from approximately equivalent region as the DTI image. Bottom: Higher magnification (60X) images demonstrating the spatial gradient in the numbers of APP stained axonal varicosities.
Figure 7
Figure 7. Quantitative Analysis of the Spatial Gradients of Relative Anisotropy Signal Changes and Histologically-Defined Axonal Injury
(A) Relative anisotropy as a function of subregions, as defined in Figure 6. There was a significant reduction in relative anisotropy ipsilaterally in subregions two and three when compared to the contralateral subregions (student’s t-test, p<0.05). (B) Number of APP stained axons per mm3 on the ipsilateral side as a function of subregion. There were significant differences between subregions, specifically; subregions two, three, and four were found to be significantly different than subregions one and five (p<0.05) (one-way ANOVA p=0.00008, F4,40=7.97 followed by Fisher post-hoc analysis). (C) Correlation between normalized relative anisotropy and numbers of APP stained axons per mm3 was significant (p=0.0021). Dashed lines represent 95% confidence band.
Figure 8
Figure 8. DTI-based Prediction of Axonal Injury in the Hippocampal Commissure
(A) DTI images demonstrating reduced RA in the hippocampal commissure following trauma. As predicted, anatomically equivalent areas of APP stained tissue show strong evidence of axonal injury in this region. (B) Quantitative analysis of MRI signal characteristics. There was a significant decrease in relative anisotropy following injury in both the ipsilateral and contralateral hippocampal commissure relative to control. Axial diffusivity was reduced more prominently in the ipsilateral hippocampal commissure than on the contralateral side. Additionally there was a significant increase in radial diffusivity on both the ipsilateral and contralateral sides relative to control. In contrast, conventional imaging methods (i.e. trace, T2 relaxation) showed no significant changes.
Figure 9
Figure 9. DTI-based Prediction of Normal Histology in the Anterior Commissure Following TBI
(A) DTI images showing RA in the anterior commissure. The APP stained regions show no positive staining that would indicate injury (4x; inset 10x). (B) There were no significant changes in any of the DTI or conventional MRI parameters in the anterior commissure following trauma.

References

    1. Adams JH. Diffuse axonal injury in non-missile head injury. Injury. 1982;13:444–445. - PubMed
    1. Adams JH, Doyle D, Graham DI, Lawrence AE, McLellan DR. Diffuse axonal injury in head injuries caused by a fall. Lancet. 1984;2:1420–1422. - PubMed
    1. Adelson PD, Ragheb J, Kanev P, Brockmeyer D, Beers SR, Brown SD, Cassidy LD, Chang Y, Levin H. Phase II clinical trial of moderate hypothermia after severe traumatic brain injury in children. Neurosurgery. 2005;56:740–754. discussion 740-754. - PubMed
    1. Arfanakis K, Haughton VM, Carew JD, Rogers BP, Dempsey RJ, Meyerand ME. Diffusion tensor MR imaging in diffuse axonal injury. AJNR Am J Neuroradiol. 2002;23:794–802. - PMC - PubMed
    1. Bammer R, Augustin M, Strasser-Fuchs S, Seifert T, Kapeller P, Stollberger R, Ebner F, Hartung HP, Fazekas F. Magnetic resonance diffusion tensor imaging for characterizing diffuse and focal white matter abnormalities in multiple sclerosis. Magn Reson Med. 2000;44:583–591. - PubMed

Publication types

MeSH terms

Substances