

Effects of specific inhibitors on anammox and denitrification in marine sediments
- PMID: 17369344
- PMCID: PMC1907100
- DOI: 10.1128/AEM.01898-06
Effects of specific inhibitors on anammox and denitrification in marine sediments
Abstract
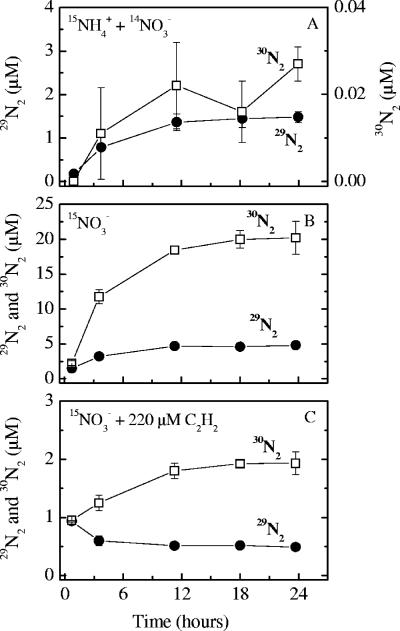
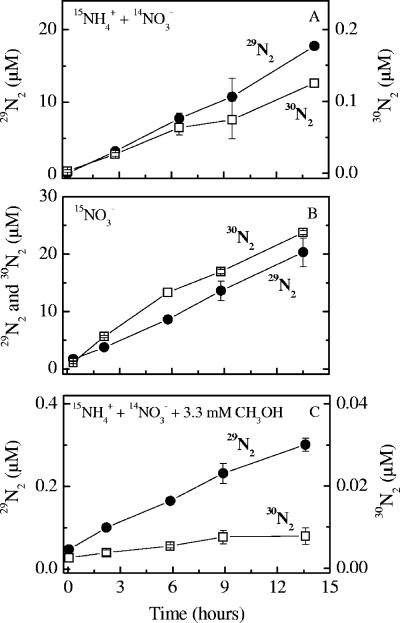
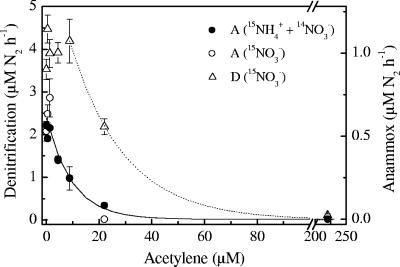
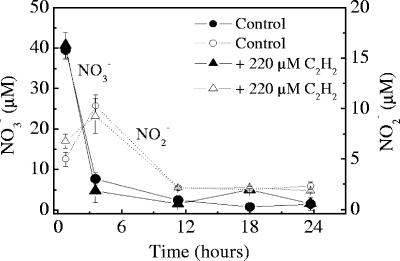
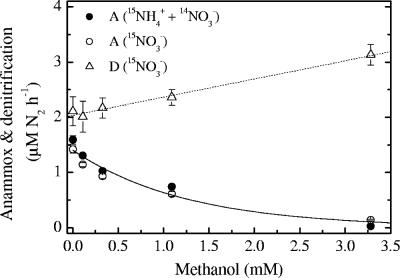
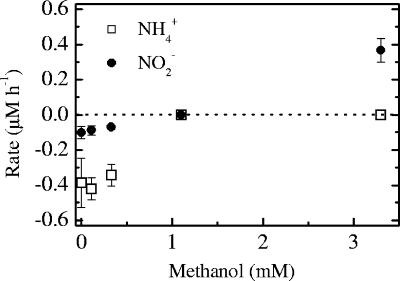
The effects of three metabolic inhibitors (acetylene, methanol, and allylthiourea [ATU]) on the pathways of N2 production were investigated by using short anoxic incubations of marine sediment with a 15N isotope technique. Acetylene inhibited ammonium oxidation through the anammox pathway as the oxidation rate decreased exponentially with increasing acetylene concentration; the rate decay constant was 0.10+/-0.02 microM-1, and there was 95% inhibition at approximately 30 microM. Nitrous oxide reduction, the final step of denitrification, was not sensitive to acetylene concentrations below 10 microM. However, nitrous oxide reduction was inhibited by higher concentrations, and the sensitivity was approximately one-half the sensitivity of anammox (decay constant, 0.049+/-0.004 microM-1; 95% inhibition at approximately 70 microM). Methanol specifically inhibited anammox with a decay constant of 0.79+/-0.12 mM-1, and thus 3 to 4 mM methanol was required for nearly complete inhibition. This level of methanol stimulated denitrification by approximately 50%. ATU did not have marked effects on the rates of anammox and denitrification. The profile of inhibitor effects on anammox agreed with the results of studies of the process in wastewater bioreactors, which confirmed the similarity between the anammox bacteria in bioreactors and natural environments. Acetylene and methanol can be used to separate anammox and denitrification, but the effects of these compounds on nitrification limits their use in studies of these processes in systems where nitrification is an important source of nitrate. The observed differential effects of acetylene and methanol on anammox and denitrification support our current understanding of the two main pathways of N2 production in marine sediments and the use of 15N isotope methods for their quantification.
Figures
Similar articles
-
Production of N(2) through anaerobic ammonium oxidation coupled to nitrate reduction in marine sediments.Appl Environ Microbiol. 2002 Mar;68(3):1312-8. doi: 10.1128/AEM.68.3.1312-1318.2002. Appl Environ Microbiol. 2002. PMID: 11872482 Free PMC article.
-
Nitrogen Removal Performance and Microbial Community Structure of IMTA Ponds (Apostistius japonicus-Penaeus japonicus-Ulva).Microb Ecol. 2024 Jun 3;87(1):82. doi: 10.1007/s00248-024-02378-z. Microb Ecol. 2024. PMID: 38831142 Free PMC article.
-
Molecular and stable isotope methods to detect and measure anaerobic ammonium oxidation (anammox) in aquatic ecosystems.Methods Enzymol. 2011;496:63-89. doi: 10.1016/B978-0-12-386489-5.00003-8. Methods Enzymol. 2011. PMID: 21514460 Review.
-
Dissimilatory reduction of nitrate and nitrite in the bovine rumen: nitrous oxide production and effect of acetylene.Appl Environ Microbiol. 1981 Mar;41(3):705-9. doi: 10.1128/aem.41.3.705-709.1981. Appl Environ Microbiol. 1981. PMID: 7224631 Free PMC article.
-
[Research progress in anammox-denitrification coupling process].Ying Yong Sheng Tai Xue Bao. 2012 Mar;23(3):849-56. Ying Yong Sheng Tai Xue Bao. 2012. PMID: 22720635 Review. Chinese.
Cited by
-
Anaerobic ammonium oxidation coupled to ferric iron reduction in the sediment of a eutrophic lake.Environ Sci Pollut Res Int. 2019 May;26(15):15084-15094. doi: 10.1007/s11356-019-04907-7. Epub 2019 Mar 27. Environ Sci Pollut Res Int. 2019. PMID: 30919193
-
Precipitation, submarine groundwater discharge of nitrogen, and red tides along the southwest Florida Gulf coast.Heliyon. 2023 May 6;9(5):e16046. doi: 10.1016/j.heliyon.2023.e16046. eCollection 2023 May. Heliyon. 2023. PMID: 37215903 Free PMC article.
-
NH2OH Disproportionation Mediated by Anaerobic Ammonium-oxidizing (Anammox) Bacteria.Microbes Environ. 2022;37(2):ME21092. doi: 10.1264/jsme2.ME21092. Microbes Environ. 2022. PMID: 35418545 Free PMC article.
-
Oxygen at nanomolar levels reversibly suppresses process rates and gene expression in anammox and denitrification in the oxygen minimum zone off northern Chile.mBio. 2014 Oct 28;5(6):e01966. doi: 10.1128/mBio.01966-14. mBio. 2014. PMID: 25352619 Free PMC article.
-
Oxygen sensitivity of anammox and coupled N-cycle processes in oxygen minimum zones.PLoS One. 2011;6(12):e29299. doi: 10.1371/journal.pone.0029299. Epub 2011 Dec 28. PLoS One. 2011. PMID: 22216239 Free PMC article.
References
-
- Andersen, T. K., M. H. Jensen, and J. Sørensen. 1984. Diurnal variation of nitrogen cycling in coastal, marine sediments. I. Denitrification. Mar. Biol. 87:171-176.
-
- Berg, P., L. Klemedtsson, and T. Rosswall. 1982. Inhibitory effect of low partial pressures of acetylene on nitrification. Soil Biol. Biochem. 14:301-303.
-
- Braman, R. S., and S. A. Hendrix. 1989. Nanogram nitrite and nitrate determination in environmental and biological materials by vanadium(III) reduction with chemiluminescence detection. Anal. Chem. 61:2715-2718. - PubMed
Publication types
MeSH terms
Substances
LinkOut - more resources
Full Text Sources
