

doi: 10.1073/pnas.0609367104.
Epub 2007 Mar 16.
High-throughput telomere length quantification by FISH and its application to human population studies
Affiliations
- PMID: 17369361
- PMCID: PMC1828130
- DOI: 10.1073/pnas.0609367104
Item in Clipboard
High-throughput telomere length quantification by FISH and its application to human population studies
Proc Natl Acad Sci U S A.
.
Abstract
A major limitation of studies of the relevance of telomere length to cancer and age-related diseases in human populations and to the development of telomere-based therapies has been the lack of suitable high-throughput (HT) assays to measure telomere length. We have developed an automated HT quantitative telomere FISH platform, HT quantitative FISH (Q-FISH), which allows the quantification of telomere length as well as percentage of short telomeres in large human sample sets. We show here that this technique provides the accuracy and sensitivity to uncover associations between telomere length and human disease.
Conflict of interest statement
The authors declare no conflict of interest.
Figures
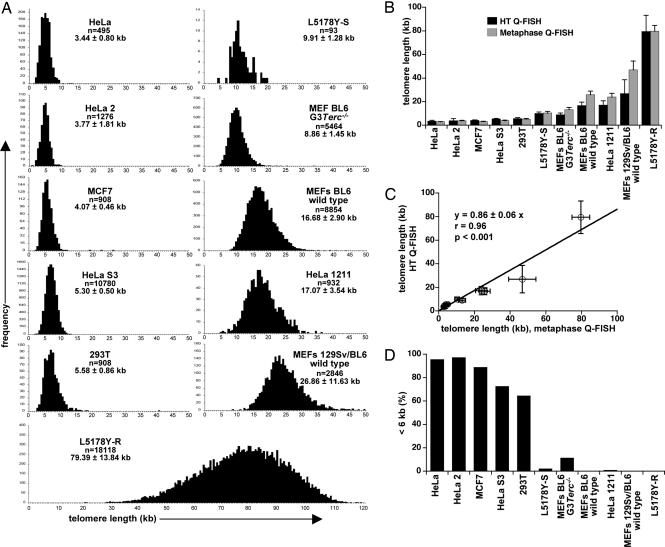
Validation of the HT Q-FISH technique. (A) HT Q-FISH histograms of telomere length distributions of the indicated cell lines. Telomere length values are given as mean ± SD, and the number of nuclei analyzed per sample (n) is indicated. (B) Mean telomere length values ± SD of the indicated cells, determined either by conventional metaphase Q-FISH (gray bars) or HT Q-FISH analysis of interphase nuclei (black bars). (C) Linear regression analysis of the correlation between mean telomere length values ± SD obtained with HT Q-FISH and metaphase Q-FISH. (D) Analysis of percentage of nuclei with short (<6 kb) telomeres by HT Q-FISH analysis of interphase nuclei. Note that G3 Terc−/− MEF show an increased percentage of nuclei with short telomeres (<6 kb) compared with wild type controls.
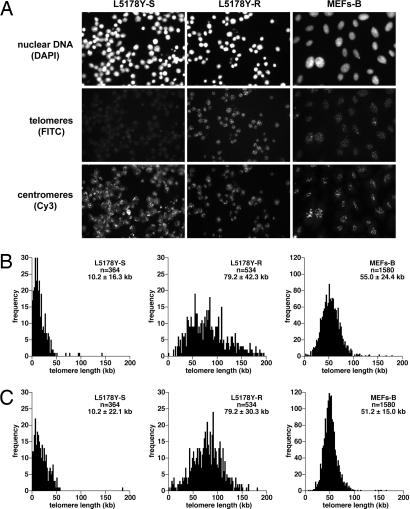
Normalization of HT Q-FISH. (A) Representative HT microscopy images of interphase nuclei stained for nuclear DNA, mouse major satellite repeats, and telomeres with DAPI-, FITC-, and Cy3-labeled PNA oligonucleotides, respectively. (B) HT Q-FISH histograms of telomere length distributions of interphase nuclei from murine lymphocytes with short (L5178Y-S cells) and long (L5178Y-R cells) telomeres and of mouse MEFs-B (MEFs 129Sv/BL6 B). Telomere length was calculated without normalization with major satellite signals. (C) Telomere length histograms after normalization with major satellite fluorescence in each nuclei. Telomere length values are given as mean ± SD, and the number of nuclei analyzed per sample (n) is indicated. Very similar distributions were obtained with or without centromeric normalization.
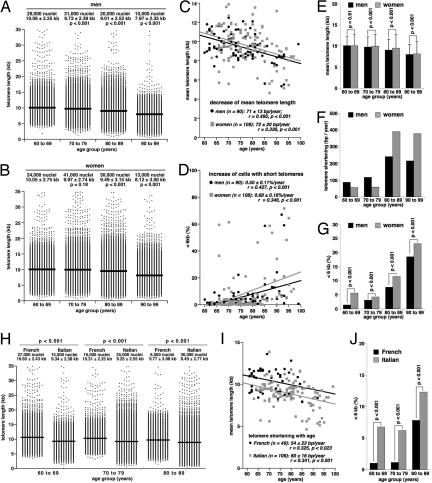
Effect of age, gender, and geographic factors on telomere length in peripheral blood lymphocytes from elderly donors. (A and B) Distribution of telomere length values in lymphocytes from male (A) and female (B) donors are grouped into the indicated age groups. Mean telomere length is indicated by a straight line. The total number of nuclei analyzed (1,000 per donor) and the mean telomere length ± SD is indicated. Statistical significance was assessed by using the Wilcoxon–Mann–Whitney rank sum test. (C and D) Linear regression analysis was used to assess the correlation between age and mean telomere length (C) or percentage of nuclei with telomeres <6 kb (D) in peripheral blood lymphocytes of these donors. (E) Mean telomere length values ± SD of male and female donors in the indicated age groups. Statistical significance was calculated using the Wilcoxon–Mann–Whitney rank sum test. (F) Rate of telomere shortening, expressed as loss of bp of telomere sequences per year, in male and female lymphocytes of the indicated age groups. (G) Percentage of nuclei with telomeres <6 kb in the indicated age groups. Fisher's Exact test was used to evaluate statistical significance. (H) Distribution of telomere length values in lymphocytes from French and Italian donors grouped into the indicated age groups. Mean telomere length is indicated by a straight line. The total number of nuclei analyzed (1,000 per donor) and the mean telomere length ± SD is indicated above each telomere length distribution. Statistical significance was calculated using the Wilcoxon–Mann–Whitney rank sum test. (I) Linear regression analysis of the correlation between age and mean telomere length in lymphocytes from these donors. (J) Percentage of nuclei with telomeres <6 kb in lymphocytes from Italian and French donors of the indicated age groups. The Fisher's exact test was used to evaluate statistical significance.
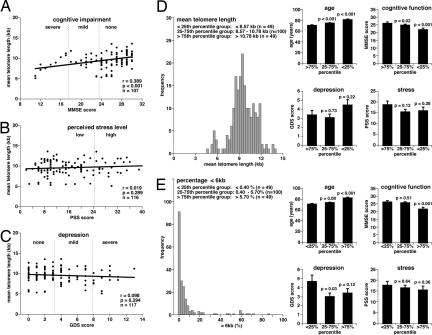
Correlation between telomere shortening and age, age-related cognitive impairment, stress, and depression. (A–C) Linear regression analysis was used to assess the correlation between cognitive impairment (A), perceived stress level (B), depression (C), and mean telomere length in lymphocytes from elderly Europeans 60–99 years of age. Mean telomere length values for each subject were obtained by HT Q-FISH analysis of 1,000 interphase nuclei per subject. The MMSE was used to assess cognitive mental status. The PSS was applied to measure the perception of stress, and depressive symptoms in the elderly were quantified with the GDS. (Materials and Methods). (D) Histogram showing the mean telomere length distribution of lymphocytes from 60- to 99-year-old donors. The 25th and 75th percentile values of this distribution were used to group donors into subjects with long (>10.78 kb), intermediate length (8.57–10.78 kb), and short (<8.57 kb) telomeres. The three groups (the graphs shown to the right) were analyzed for age, cognitive function (MMSE score), depression (GDS score), and perceived stress (PSS score). Data are mean values ± SEM, and the statistical significance of differences was assessed using the Wilcoxon–Mann–Whitney rank sum test. (E) Histogram showing the distribution of percentage of nuclei with telomeres <6kb in lymphocytes of the 60- to 99-year-old donors. The 25th and 75th percentile values of the distribution were used to group donors into subjects with a high (>5.7%), intermediate (0.4–5.7%), and low (<0.4%) abundance of nuclei with short telomeres, corresponding to the >75th percentile, 25–75th percentile, and <25th percentile groups, respectively. The three groups (graphs shown to the right) were analyzed for age, cognitive function (MMSE score), symptoms of depression (GDS score), and perceived stress (PSS score). Data are mean values ± SEM, and statistical significance was assessed using the Wilcoxon–Mann–Whitney rank sum test.
References
-
- Chan SW, Blackburn EH. Oncogene. 2002;21:553–563. - PubMed
-
- Greider CW, Blackburn EH. Cell. 1985;43:405–413. - PubMed
-
- Flores I, Benetti R, Blasco MA. Curr Opin Cell Biol. 2006;18:254–260. - PubMed
-
- Harley CB, Futcher AB, Greider CW. Nature. 1990;345:458–460. - PubMed
-
- Blasco MA, Lee HW, Hande MP, Samper E, Lansdorp PM, DePinho RA, Greider CW. Cell. 1997;91:25–34. - PubMed
Publication types
MeSH terms
LinkOut - more resources
Full Text Sources
Other Literature Sources
