. 2007 Jun 1;92(11):4030-44.
doi: 10.1529/biophysj.106.095463. Epub 2007 Mar 16.

A mathematical model of the slow force response to stretch in rat ventricular myocytes

Affiliations

A mathematical model of the slow force response to stretch in rat ventricular myocytes

Steven A Niederer et al. Biophys J. .

Abstract

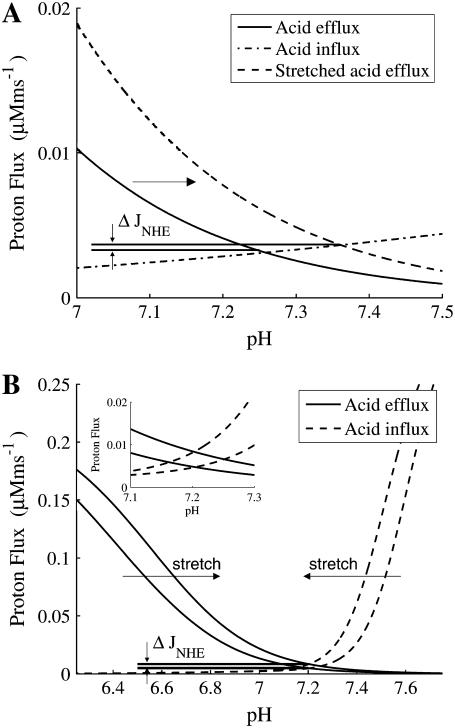
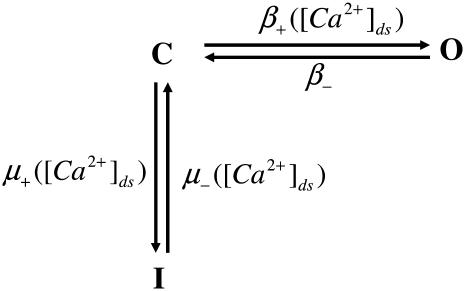
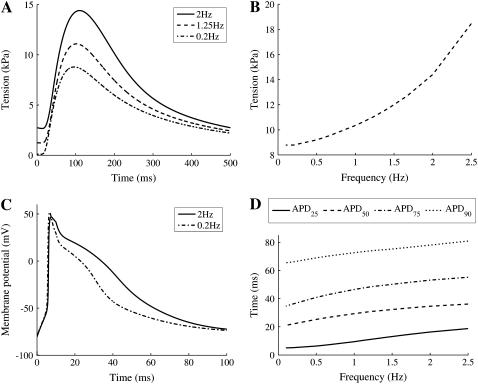
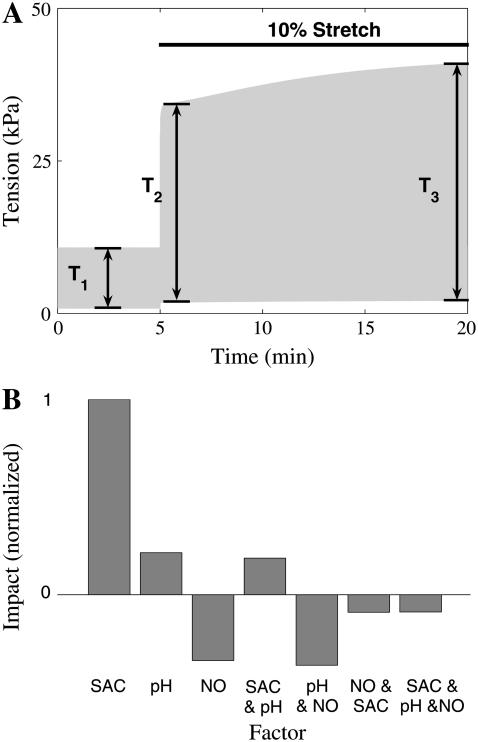
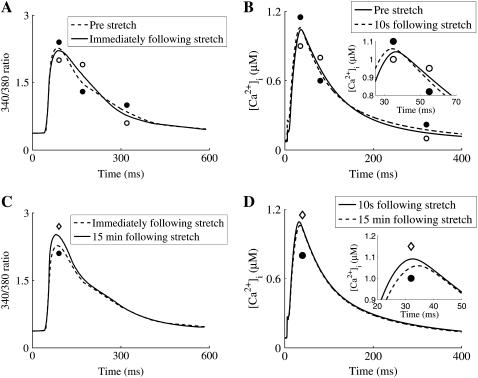
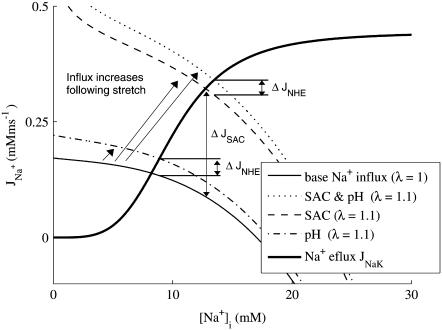
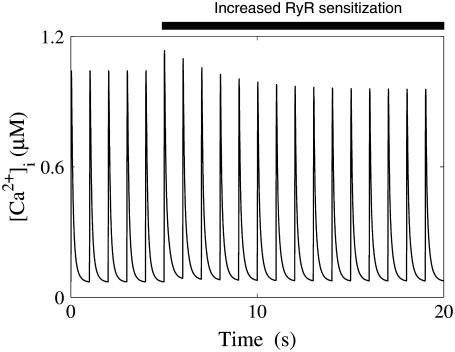
We developed a model of the rat ventricular myocyte at room temperature to predict the relative effects of different mechanisms on the cause of the slow increase in force in response to a step change in muscle length. We performed simulations in the presence of stretch-dependent increases in flux through the Na(+)-H(+) exchanger (NHE) and Cl(-)-HCO(3)(-) exchanger (AE), stretch-activated channels (SAC), and the stretch-dependent nitric oxide (NO) induced increased open probability of the ryanodine receptors to estimate the capacity of each mechanism to produce the slow force response (SFR). Inclusion of stretch-dependent NHE & AE, SACs, and stretch-dependent NO effects caused an increase in tension following 15 min of stretch of 0.87%, 32%, and 0%, respectively. Comparing [Ca(2+)](i) dynamics before and after stretch in the presence of combinations of the three stretch-dependent elements, which produced significant SFR values (>20%), showed that the inclusion of stretch-dependent NO effects produced [Ca(2+)](i) transients, which were not consistent with experimental results. Further simulations showed that in the presence of SACs and the absence of stretch-dependent NHE & AE inhibition of NHE attenuated the SFR, such that reduced SFR in the presence of NHE blockers does not indicate a stretch dependence of NHE. Rather, a functioning NHE is responsible for a portion of the SFR. Based on our simulations we estimate that in rat cardiac myocytes at room temperature SACs play a significant role in producing the SFR, potentially in the presence of stretch-dependent NHE & AE and that NO effects, if any, must involve more mechanisms than just increasing the open probability of ryanodine receptors.


Figures

FIGURE 1
FIGURE 1
(A) Steady-state flux across NHE as a function of pHi in rat cardiac myocytes for experimental measurements (points) (34) and fitted model simulations with pHo = 7.4, [Na+]o = 140 mM, and [Na+]i = 10 mM (line). (B) Comparison between fitted model, with [Na+]o = 140 mM, pHi = 6.4, and pHo = 7.4 (solid line) and normalized flux across the NHE recorded in sheep Purkinje fibers (solid squares) as a function of [Na+]i (35).
FIGURE 2
FIGURE 2
(A) Change in acid flux following 10% stretch in HEPES buffered solution (no AE or NBC). Solid and dash-dotted lines show the acid efflux and influx as functions of pHi before stretch, respectively. Following 10% stretch, the flux through NHE increases shifting the acid efflux curve to the right from the solid line to the dashed line. Resulting in a 0.1 pH unit increase in pHi and an increase in flux through NHE of ΔJNHE = 0.00054 μM ms−1. (B) Change in acid flux following a 10% stretch in 5% CO2 bicarbonate buffered solution. Solid lines and dashed lines are the acid efflux and influx as functions of pHi, respectively. Following a 10% stretch, acid efflux shifts right and acid influx shifts left as indicated by the arrows. An enlargement of the change in intersection of the acid influx and efflux is shown in the figure inset. Stretch results in an increase in NHE flux of ΔJNHE = 0.0036 μM ms−1 and no change in pHi.
FIGURE 3
FIGURE 3
Schematic of RyR model from the Hinch et al. (24) Ca2+ model. The model has three states: closed (C), open (O), and inactivated (I). The opening rate (β+) between C and O and both activation (μ+) and inactivation (μ) rates between I and C are [Ca2+]ds dependent. The closing rate (β) between O and C is constant.
FIGURE 4
FIGURE 4
Plot of [Na+]i as a function of frequency. Experimental data (points) taken from Despa et al. (60). Maximum flux through NaK was fitted to achieve model [Na+]i response (dashed line).
FIGURE 5
FIGURE 5
(A) Model simulations of tension transient with no strain (λ = 1), at 0.2 Hz (dash-dotted line), 1.25 Hz (dashed line), and 2 Hz (solid line). (B) Increase in peak tension with pacing frequency between 0.1 and 2 Hz with no strain (λ = 1). (C) Model simulations of action potential, at 0.2 Hz (dash-dotted line) and 2 Hz (solid line). (D) The time taken for 90% (APD90, dotted line), 75% (APD75, dash-dotted line), 50% (APD50, dashed line), and 25% (APD25, solid line) repolarization with pacing frequency between 0.1 and 2 Hz.
FIGURE 6
FIGURE 6
(A) Example tension trace from SFR simulation, in the presence of SACs. Cell is paced at 1 Hz at rest (λ = 1) after 5 min a 10% stretch (λ = 1.1) is applied for 15 min. T1, T2, and T3 are the active tension before, 10 s after, and 15 min after stretch, respectively. (B) Impact of individual and combinations of SACs (SAC), stretch-dependent NHE & AE (pH), and increased open probability of RyRs due to stretch released NO (NO) on the SFR, as determined from a factorial experiment design. The impact of each factor or combination was normalized against the maximum impact (in this case SAC).
FIGURE 7
FIGURE 7
Example comparison of [Ca2+]i between model simulations in the presence of stretch-dependent NHE & AE and SACs and experimental results from Kentish and Wrzosek (1). (A) 340:380 ratio (a measure of [Ca2+]i) transients prestretch (solid line and open circles) and immediately after stretch (solid line and solid circles). (B) Simulation [Ca2+]i transients prestretch (solid line and open circles) and 10 s after stretch (solid line and solid circles); inset shows enlargement of crossover of transients at the peak. (C) 340:380 ratio transients immediately after stretch (solid line and solid circles) and 15 min after stretch (solid line and open diamonds). (D) Simulation [Ca2+]i transients 10 s after stretch (solid line and solid circles) and 15 min after stretch (solid line and open diamonds) inset shows enlargement of transients at the peak.
FIGURE 8
FIGURE 8
Comparison between simulation indices of [Ca2+]i transients (plots b, d, f, and h) and experimental indices of 340:380 ratio (a measure of [Ca2+]i) transients (1) (plots a, c, e, and g) before stretch, 10 s after a 10% strain, and 15 min after a 10% strain. Model simulations contain four combinations of the stretch-dependent elements: SACs (SAC, dashed line and open squares), SACs and stretch-dependent NHE & AE (SAC & pH, dash-dotted line and solid squares), SACs and stretch-dependent NO effects (SAC & NO dotted line and open diamonds), and SACs and stretch-dependent NO and NHE & AE effects (SAC & NO & pH, solid line and solid diamonds). (A and B) Peak measure of [Ca2+]i. (C and D) Time to peak. (E and F) Time for the transient to fall to half of its maximum amplitude (RT50). (G and H) Time for the transient to fall to 10% of its maximum amplitude (RT90).
FIGURE 9
FIGURE 9
SFR following 10% stretch for 15 min for models containing SACs (SAC) and SACs and stretch-dependent NHE & AE (pH) in the presence (control) and absence (NHE inhibition) of NHE.
FIGURE 10
FIGURE 10
Changes in Na+ influx and efflux in the presence of SAC and/or pH stretch-dependent elements, following stretch, in the quiescent cell. Fluxes are calculated as a function of [Na+]i with [K+]i, [Ca2+]i, [Ca2+]SR, and Vm clamped at their quiescent values of 144.19, 6.508 × 10⁻⁵, 0.6817 mM, and −79.90 mV, respectively. Na+ efflux through NaK (bold solid line), Na+ influx prestretch (solid line), and Na+ influx following 10% stretch in the presence of stretch-dependent NHE & AE (pH, dot-dashed line), stretch-dependent NHE & AE, and SAC (SAC & pH dotted line), and SACs (SAC dashed line). ΔJNHE indicates the change in Na+ flux caused by the addition of stretch-dependent NHE. ΔJSAC indicates the change in Na+ flux caused by the addition off SACs.
FIGURE 11
FIGURE 11
The effects of increased RyR sensitization on the [Ca2+]i transient. Initially the [Ca2+]i transient is at a steady state at a 1 Hz pacing frequency. After 5 s a 50% increase in RyR open probability was applied by decreasing the rate of closing of the RyRs by 50%.

Similar articles

Cited by

References

    1. Kentish, J. C., and A. Wrzosek. 1998. Changes in force and cytosolic Ca2+ concentration after length changes in isolated rat ventricular trabeculae. J. Physiol. (Lond.). 506:431–444. - PMC - PubMed
    1. Allen, D. G., and S. Kurihara. 1982. The effects of muscle length on intracellular calcium transients in mammalian cardiac-muscle. J. Physiol. (Lond.). 327:79–94. - PMC - PubMed
    1. Todaka, K., K. Ogino, A. Gu, and D. Burkhoff. 1998. Effect of ventricular stretch on contractile strength, calcium transient, and camp in intact canine hearts. Am. J. Physiol. 274:H990–1000. - PubMed
    1. Hongo, K., E. White, J. Y. Le Guennec, and C. H. Orchard. 1996. Changes in [Ca2+]i, [Na+]i and Ca2+ current in isolated rat ventricular myocytes following an increase in cell length. J. Physiol. (Lond.). 491:609–619. - PMC - PubMed
    1. Calaghan, S. C., A. Belus, and E. White. 2003. Do stretch-induced changes in intracellular calcium modify the electrical activity of cardiac muscle? Prog. Biophys. Mol. Biol. 82:81–95. - PubMed

Publication types

LinkOut - more resources