. 2007 Jun 1;92(11):4109-20.
doi: 10.1529/biophysj.106.094649. Epub 2007 Mar 16.

Stepwise movements in vesicle transport of HER2 by motor proteins in living cells

Affiliations

Stepwise movements in vesicle transport of HER2 by motor proteins in living cells

Tomonobu M Watanabe et al. Biophys J. .

Abstract

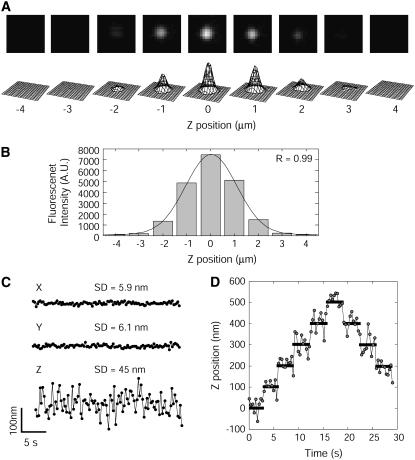
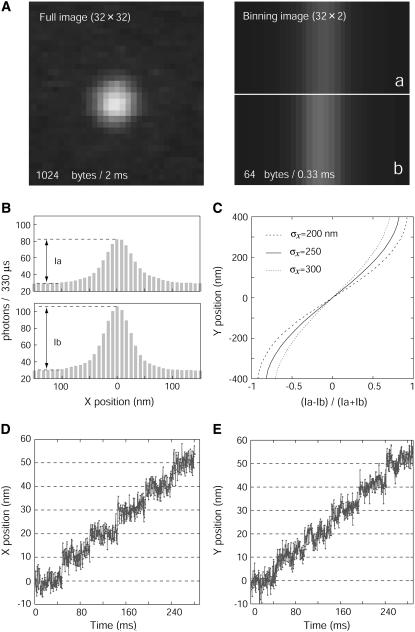
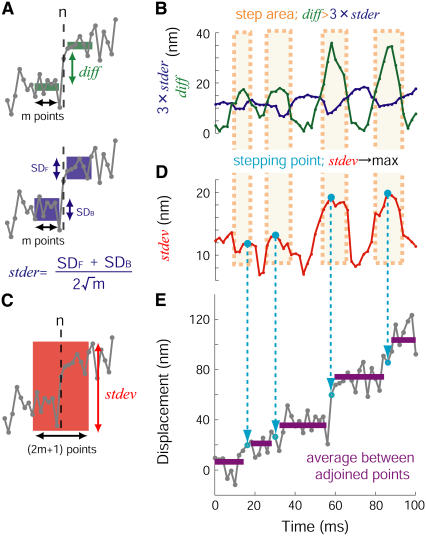
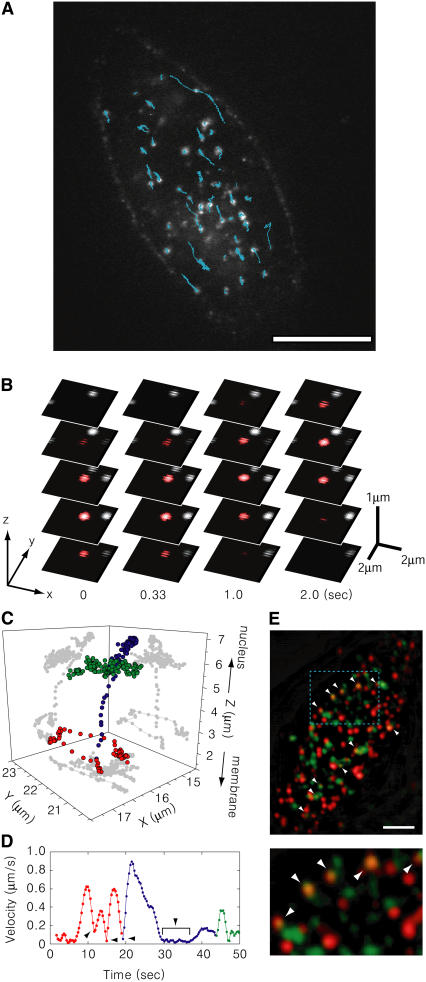
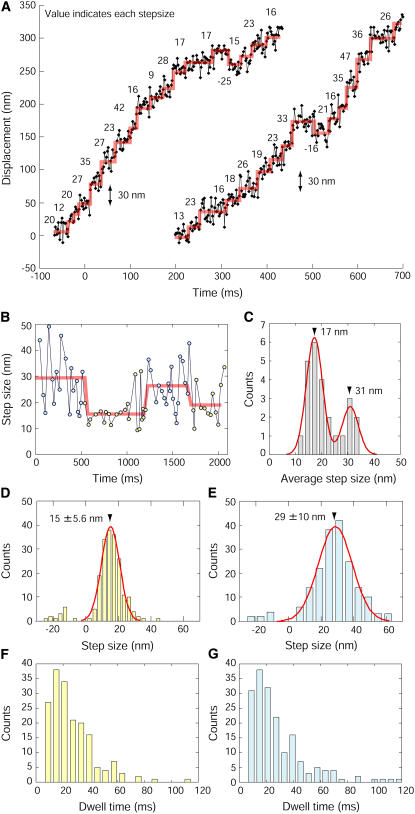
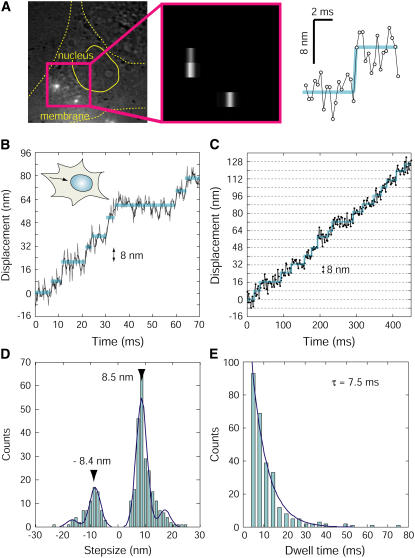
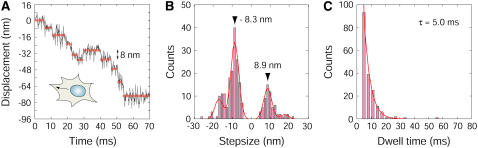
The stepwise movements generated by myosin, dynein, and kinesin were observed in living cells in an attempt to understand the molecular mechanisms of movement within cells. First, the sequential process of the transport of vesicles, including human epidermal factor 2 receptor, after endocytosis was observed for long periods in three dimensions using quantum dots (QDs) and a three-dimensional confocal microscope. QD vesicles, after being endocytosed into the cells, moved along the membrane by transferring actin filaments and were then rapidly transported toward the nucleus along microtubules. Second, the position of vesicles was detected with a precision up to 1.9 nm and 330 micros using a new two-dimensional tracking method. The movement of the QDs transported by myosin VI lying just beneath the cell membrane consisted of 29- and 15-nm steps with a transition phase between these two steps. QD vesicles were then transported toward the nucleus or away from the nucleus toward the cell membrane with successive 8-nm steps. The stepwise movements of these motor proteins in cells were observed using new imaging methods that allowed the molecular mechanisms underlying traffic to and from the membrane to be determined.


Figures

FIGURE 1
FIGURE 1
Three-dimensional single particle tracking. (A) Image set of an optical section of a QD at various focal positions. Upper panels are the fluorescence images of the QD at the various focal positions. Lower panels show the 3D expressions of the intensity profiles of the upper panels. (B) Relationship between the focal (Z) position and the fluorescence intensity. Black line is a single Gaussian curve fitted to the intensities. The peak occurred at 0.1 μm. (C) Spatial precision of 3D single particle tracking. Standard deviations of tracking using 3D single particle tracking were 6 nm (XY-plane) and 45 nm (Z axis). (D) Precision of the Z-direction determined using 3D single particle tracking. QDs bound on a coverslip were moved 100 nm along the focal axis by a Piezo actuator. The movement of the QDs was tracked using 3D single particle tracking in three dimensions. Only the Z-position of the QD is shown here.
FIGURE 2
FIGURE 2
Procedure of binning FIONA. (A) Binning of fluorescent image of QD. Left panel is a part (32 × 32 pixels) of full image (128 × 128 pixels) and the right panel is a binning image with 16 pixels in the bin. The information volume decreased 16-fold and the acquisition time of EM-CCD improved from 2 to 0.33 ms. (B) Fluorescent profiles of two bins after the binning process. Ia and Ib indicate the fluorescent intensities of a and b in right side of panel A. (C) Calibration table for the Y axis. Calibration curve depends on the width of the point spread function (σx). (D and E) QD fixed on a coverslip was moved by 10-nm steps using a Piezo actuator. The position of the QDs was determined with a temporal resolution of 330 μs, and showed 10-nm steps with noise of 1.9 nm (X axis, D) and 2.0 nm (Y axis, E).
FIGURE 3
FIGURE 3
Determination of steps and step size. These panels show a procedure of a step detection algorithm used in this study. (A) The differences between the averages of the data points in the forward and backward over n-th data (diff) have been compared to the degree of fluctuation in same data (stder). (B) When diff was larger than 3stder the area was considered to be a step area (orange). (C and D) The algorithm defined the data that had the maximum standard deviation (stdev, C) in one step area as a stepping point (cyan circle, D). (E) Dwell displacement was calculated by averaging adjoining stepping points. Left panel shows the definition of each of the parameters, diff, stder, and stdev. A detail explanation is described in Materials and Methods.
FIGURE 4
FIGURE 4
Movements of anti-HER2-QDs in living cells. (A) Fluorescence confocal image of anti-HER2-QDs in KPL4 cells. Bar indicates 10 μm. White spots are individual vesicles labeled with anti-HER2-QD. Cyan lines are the trajectories of the movements of individual anti-HER2-QDs for a 10-s period. (B) Three-dimensional movement of the anti-HER2-QD. The confocal images at various focus positions are arranged vertically. The red spot is an example of a moving QD. (C) Three-dimensional movement of the transport of HER2 from the membrane to the nucleus after endocytosis. Z axis is the axis from the membrane to the nucleus, and XY-plane is parallel with the membrane. Red, blue, and green circles indicate movement along the membrane, transport toward the nucleus, and drift around the nucleus, respectively. (D) The time course of the velocity of the movement in panel C averaged for a 3-s period. Red circles indicate the movements near the membrane, and blue circles indicate movement toward the nucleus. Arrowheads indicate the cessation of movement. The colors correspond, respectively, to those explained in C. (E) Colocalization of myosin VI and anti-HER2-QD observed under the TIRF microscope. Myosin VI was immunolabeled with anti-myosin VI and FITC-anti-IgG (green spots). Anti-HER2-QDs bound to HER2 on the membrane, and some of the QDs internalized into the cytoplasm after endocytosis (red spots). White arrows indicate the QD spots that overlapped with those of myosin VI. Scale bar is 5 μm. Lower panel is an enlargement of the region depicted in cyan in the upper panel.
FIGURE 5
FIGURE 5
Stepwise movements of the transport of the vesicles beneath the membrane. (A) Typical traces obtained for the transport beneath the membrane at 30°C. Red lines indicate the individual steps. Values are the sizes of each step detected by the computer programming. (B) Switching of the step size. Red lines indicate the stepwise changes of the step size. Yellow and cyan indicate the periods where the steps were small and large, respectively. (C) Histogram of the average step size until the step size changed. Data was fitted with the Gaussian distribution with peaks at 30.9 and 17.2 nm (n = 25). (D and E) Histogram of the step sizes for periods with small (D) and large steps (E). The peak of the Gaussian distribution fitted to the data for periods where the steps were small was 15 nm with a halfwidth of 5.6 nm (n = 202). The peak for the period where the steps were large occurred at 29 nm with a halfwidth of 10 nm (n = 188). (F and G) Dwell time of period where the steps were small (F) and large (G). The mean dwell time of period where the steps were small and large were 29 ms (n = 202) and 32 nm (n = 188), respectively.
FIGURE 6
FIGURE 6
Stepwise movements of the transport of the vesicles toward the nucleus (inward movement). (A) An incident-light image and fluorescence image obtained using binning FIONA. To confirm the direction of the movement of vesicles, the incident-light image of the cell was observed when the fluorescence image of QD vesicles was overlapping (left). The 16 pixels on the Y axis of the fluorescent image were binned into one bar (middle). The 8-nm step was clearly observed by using binning FIONA (right). (B) A typical trace of the movement toward the nucleus at 30°C. Gray line is the raw data, and the black line is the average line for the three data sets. (C) Typical trace of the movement toward the nucleus at 20°C. Blue lines in panels A, B, and C indicate steps detected by the computer programming. (D) Histogram of step sizes of the movements toward the nucleus. Data was fitted with four Gaussian curves (n = 318). The main peak values were −8.4 and 8.5, respectively. (E) Histogram of the dwell times of the movements toward the nucleus. Data were fitted with single exponential function with a time constant of 7.5 ms (n = 288).
FIGURE 7
FIGURE 7
Stepwise movements from the nucleus toward the cell membrane (outward movement). (A) Typical trace of the movement away from the nucleus at 30°C. Gray line is the raw data, and the black line is average line for the three data sets. Red lines indicate steps detected by the computer programming. (B) Histogram of the step sizes of the movement away from the nucleus. Data were fitted with four Gaussian curves (n = 238). The main peak values were −8.3 and 8.9, respectively. (C) Histogram of dwell time of the movement away from the nucleus. Data were fitted with single exponential function with the time constant of 5.0 ms (n = 180).

Similar articles

Cited by

References

    1. Hirokawa, N. 1998. Kinesin and dynein superfamily proteins and the mechanism of organelle transport. Science. 279:519–526. - PubMed
    1. Tuxworth, R. I., and M. A. Titus. 2000. Unconventional myosins: anchors in the membrane traffic relay. Traffic. 1:11–18. - PubMed
    1. Funatsu, T., Y. Harada, M. Tokunaga, K. Saito, and T. Yanagida. 1995. Imaging of single fluorescent molecules and individual ATP turnovers by single myosin molecules in aqueous solution. Nature. 374:555–559. - PubMed
    1. Vale, R. D., T. Funatsu, D. W. Pierce, L. Romberg, Y. Harada, and T. Yanagida. 1996. Direct observation of single kinesin molecules moving along microtubules. Nature. 380:451–453. - PMC - PubMed
    1. Tokunaga, M., K. Kitamura, K. Saito, A. H. Iwane, and T. Yanagida. 1997. Single molecule imaging of fluorophores and enzymatic reactions achieved by objective-type total internal reflection fluorescence microscopy. Biochem. Biophys. Res. Commun. 235:47–53. - PubMed

Publication types