Multidimensional detection and analysis of Ca2+ sparks in cardiac myocytes
- PMID: 17369419
- PMCID: PMC1877778
- DOI: 10.1529/biophysj.106.089359
Multidimensional detection and analysis of Ca2+ sparks in cardiac myocytes
Abstract
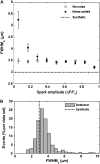
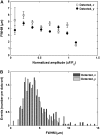
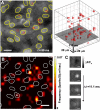
Examining calcium spark morphology and its relationship to the structure of the cardiac myocyte offers a direct means of understanding excitation-contraction coupling mechanisms. Traditional confocal line scanning achieves excellent temporal spark resolution but at the cost of spatial information in the perpendicular dimension. To address this, we developed a methodology to identify and analyze sparks obtained via two-dimensional confocal or charge-coupled device microscopy. The technique consists of nonlinearly subtracting the background fluorescence, thresholding the data on the basis of noise level, and then localizing the spark peaks via a generalized extrema test, while taking care to detect and separate adjacent peaks. In this article, we describe the algorithm, compare its performance to a previously validated spark detection algorithm, and demonstrate it by applying it to both a synthetic replica and an experimental preparation of a two-dimensional isotropic myocyte monolayer exhibiting sparks during a calcium transient. We find that our multidimensional algorithm provides better sensitivity than the conventional method under conditions of temporally heterogeneous background fluorescence, and the inclusion of peak segmentation reduces false negative rates when spark density is high. Our algorithm is robust and can be effectively used with different imaging modalities and allows spark identification and quantification in subcellular, cellular, and tissue preparations.
Figures


Similar articles
-
A new approach to the detection and statistical classification of Ca2+ sparks.Biophys J. 2007 Jun 15;92(12):4458-65. doi: 10.1529/biophysj.106.103069. Epub 2007 Mar 30. Biophys J. 2007. PMID: 17400702 Free PMC article.
-
Polymorphism of Ca2+ sparks evoked from in-focus Ca2+ release units in cardiac myocytes.Biophys J. 2004 Jan;86(1 Pt 1):182-90. doi: 10.1016/S0006-3495(04)74095-3. Biophys J. 2004. PMID: 14695261 Free PMC article.
-
Regional differences in spontaneous Ca2+ spark activity and regulation in cat atrial myocytes.J Physiol. 2006 May 1;572(Pt 3):799-809. doi: 10.1113/jphysiol.2005.103267. J Physiol. 2006. PMID: 16484302 Free PMC article.
-
Imaging microdomain Ca2+ in muscle cells.Circ Res. 2004 Apr 30;94(8):1011-22. doi: 10.1161/01.RES.0000125883.68447.A1. Circ Res. 2004. PMID: 15117829 Review.
-
Development of excitation-contraction coupling in cardiomyocytes.Jpn J Physiol. 2004 Feb;54(1):1-6. doi: 10.2170/jjphysiol.54.1. Jpn J Physiol. 2004. PMID: 15040842 Review.
Cited by
-
CellSpecks: A Software for Automated Detection and Analysis of Calcium Channels in Live Cells.Biophys J. 2018 Dec 4;115(11):2141-2151. doi: 10.1016/j.bpj.2018.10.015. Epub 2018 Oct 25. Biophys J. 2018. PMID: 30447989 Free PMC article.
-
Automated detection and analysis of Ca(2+) sparks in x-y image stacks using a thresholding algorithm implemented within the open-source image analysis platform ImageJ.Biophys J. 2014 Feb 4;106(3):566-76. doi: 10.1016/j.bpj.2013.12.040. Biophys J. 2014. PMID: 24507597 Free PMC article.
-
Automated detection and analysis of depolarization events in human cardiomyocytes using MaDEC.Comput Biol Med. 2016 Aug 1;75:109-17. doi: 10.1016/j.compbiomed.2016.05.011. Epub 2016 May 26. Comput Biol Med. 2016. PMID: 27281718 Free PMC article.
-
SparkMaster 2: A New Software for Automatic Analysis of Calcium Spark Data.Circ Res. 2023 Sep;133(6):450-462. doi: 10.1161/CIRCRESAHA.123.322847. Epub 2023 Aug 9. Circ Res. 2023. PMID: 37555352 Free PMC article.
-
PunctaSpecks: A tool for automated detection, tracking, and analysis of multiple types of fluorescently labeled biomolecules.Cell Calcium. 2020 Jul;89:102224. doi: 10.1016/j.ceca.2020.102224. Epub 2020 May 25. Cell Calcium. 2020. PMID: 32502904 Free PMC article.
References
-
- Fabiato, A. 1983. Calcium-induced release of calcium from the cardiac sarcoplasmic reticulum. Am. J. Physiol. 245:C1–C14. - PubMed
-
- Cheng, H., W. J. Lederer, and M. B. Cannell. 1993. Calcium sparks: elementary events underlying excitation-contraction coupling in heart. Science. 262:740–744. - PubMed
-
- Cheng, H., M. R. Lederer, W. J. Lederer, and M. B. Cannell. 1996. Calcium sparks and [Ca2+]i waves in cardiac myocytes. Am. J. Physiol. Cell Physiol. 270:C148–C159. - PubMed
-
- López-López, J. R., P. S. Shacklock, C. W. Balke, and W. G. Wier. 1995. Local calcium transients triggered by single L-type calcium channel currents in cardiac cells. Science. 268:1042–1045. - PubMed
Publication types
MeSH terms
Substances
LinkOut - more resources
Full Text Sources
Other Literature Sources
Miscellaneous

