. 2007 Jun 1;92(11):3901-14.
doi: 10.1529/biophysj.106.102400. Epub 2007 Mar 16.

On the mechanism of TBA block of the TRPV1 channel

Affiliations

On the mechanism of TBA block of the TRPV1 channel

Andrés Jara Oseguera et al. Biophys J. .

Abstract

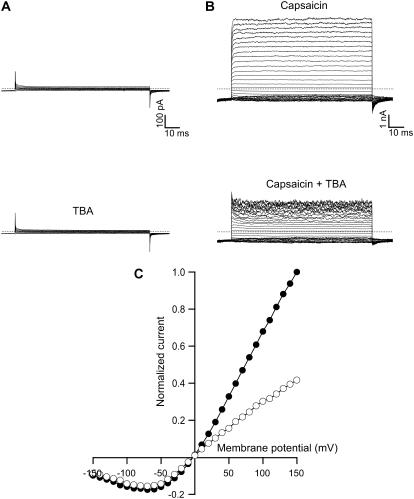
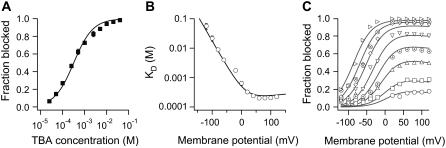
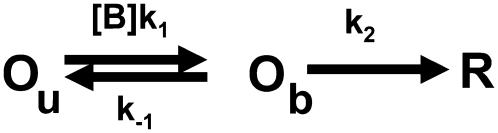
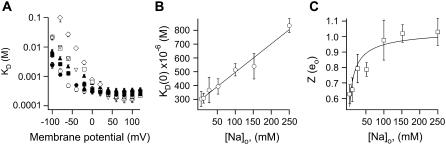
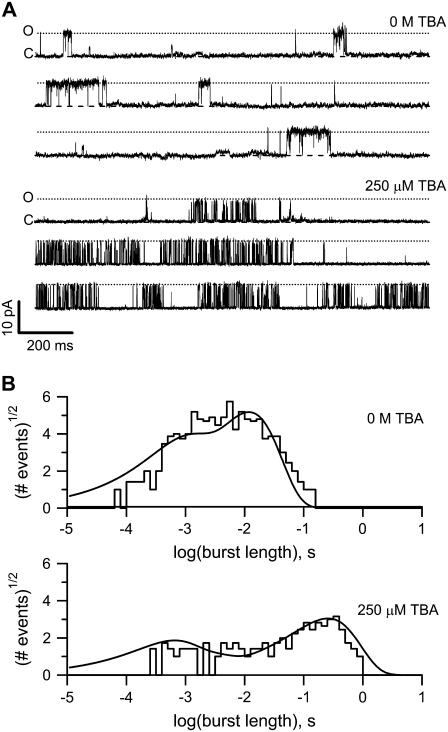
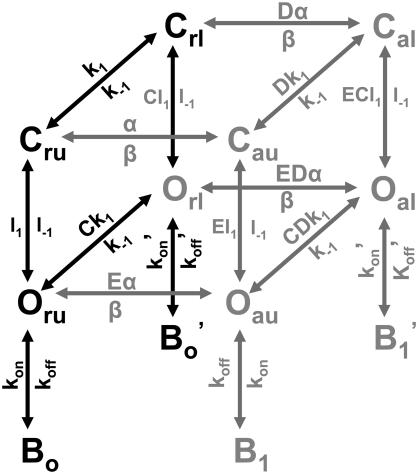
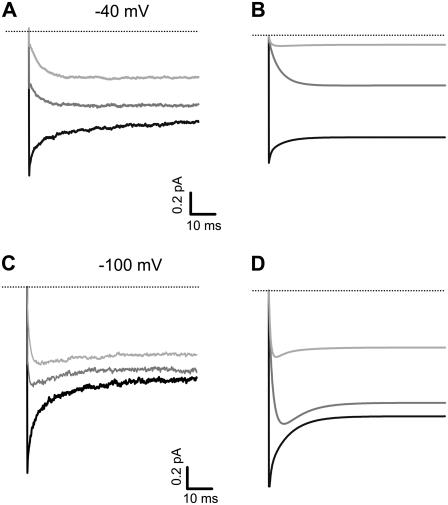
The transient receptor potential vanilloid 1 (TRPV1) channel is a nonselective cation channel activated by capsaicin and responsible for thermosensation. To date, little is known about the gating characteristics of these channels. Here we used tetrabutylammonium (TBA) to determine whether this molecule behaves as an ion conduction blocker in TRPV1 channels and to gain insight into the nature of the activation gate of this protein. TBA belongs to a family of classic potassium channel blockers that have been widely used as tools for determining the localization of the activation gate and the properties of the pore of several ion channels. We found TBA to be a voltage-dependent pore blocker and that the properties of block are consistent with an open-state blocker, with the TBA molecule binding to multiple open states, each with different blocker affinities. Kinetics of channel closure and burst-length analysis in the presence of blocker are consistent with a state-dependent blocking mechanism, with TBA interfering with closing of an activation gate. This activation gate may be located cytoplasmically with respect to the binding site of TBA ions, similar to what has been observed in potassium channels. We propose an allosteric model for TRPV1 activation and block by TBA, which explains our experimental data.


Figures

FIGURE 1
FIGURE 1
Block of TRPV1 currents by intracellular TBA. (A) Currents from a nontransfected cell in the absence (top panel) and presence of 250 μM TBA (lower panel). (B) Current traces without TBA (top panel) and with 250 μM TBA (lower panel) in the same patch from a cell transfected with TRPV1. The currents were elicited by stepping membrane voltage from the 0 mV holding potential to −120 mV and then to various test potentials from −150 to 150 mV in 10 mV increments (see Materials and Methods). Currents in (B) were obtained in the presence of 4 μM capsaicin and corrected for background current in the absence of agonist. The dotted lines identify the zero current levels. (C) Normalized current-voltage plots obtained from the current traces shown in B (top panel, solid symbols and lower panel, open symbols). Data were normalized to the maximum current obtained in the absence of TBA at 150 mV.
FIGURE 2
FIGURE 2
TBA block characteristics. (A) Effect of TBA on the fraction of blocked channels. Average blocking dose-response as a function of TBA concentration obtained from nine patches. Block by TBA was completely reversible. The Hill equation (Eq. 1) was fitted to the data with parameters n = 0.89 and KD = 280 μM. (B) Voltage dependence of KD measured from five patches. The continuous line is the predicted KD as a function of voltage from the permeant blocker model shown in Scheme 1. The rate constants used are: k1 = 5 × 10⁵ M−1s−1 × exp(0.99eoV/kT), k1 = 90s−1 × exp(−0.13eoV/kT), k2 = 163s−1 × exp(0.02eoV/kT). These rate constants were constrained to be similar to those obtained from data on TBA kinetics of block shown in Fig. 6. (C) The fraction of blocked channels as a function of voltage in the presence of TBA. Increasing concentrations are indicated by the following symbols (in μM): ○, 50; □, 100; ▵, 250; ⊕, 500; ▿, 1000; ⋄, 2500; ⊗, 5000; ▹, 10,000. Continuous lines are the predictions from the same model and parameters used in (B).
SCHEME 1
SCHEME 1
Simple mechanism for relief of block.
FIGURE 3
FIGURE 3
Ion interactions in TRPV1 channels. (A) The effect of extracellular Na+ on the voltage dependence of KD, estimated from Eq. 1. Different symbols represent varying Na+ concentrations: ○, 5 mM; •, 12 mM; ▪, 27 mM; ▴, 52 mM; ▿, 102 mM; □, 152 mM; ⋄, 252 mM. Data were obtained from three to six patches. (B) The KD at 0 mV is plotted as a function of extracellular Na+ concentration; the continuous curve is a fit of a line to the data. (C) Voltage dependence of KD at negative voltages. The value of Z was obtained from fits of Eq. 2 to the data in (A) from −120 to −20 mV. The continuous curve is a fit to the Hill equation, with a steepness factor of 0.6 and a K1/2 of 5 mM.
FIGURE 4
FIGURE 4
A multi-ion permeation model explains saturation of block. (A) The permeation and block model used for simulations. There are four ion binding sites in the selectivity filter and two more sites, one on the internal cavity (left) and one on the external cavity (right). TBA (gray circles) binds in the internal cavity and does not enter the selectivity filter. The fraction of electric field (δ) traversed in each transition is partitioned as follows. Transitions among sites in the selectivity filter have a δ = 0.22, entering the internal cavity δ = 0.06, and entering the external cavity δ =0.06. There is a repulsive interaction between blocker and permeant ions and between permeant ions whenever two contiguous sites are occupied at the same time. The factor is √r with r = 700, which decreases forward rate constants by a factor 1/√r and increases backward rate constants by √r. (B) The effect of extracellular Na+ on the voltage dependence of KD. The same data as in Fig. 3 A are shown with the predictions from Scheme 2 superimposed. (C) The KD at 0 mV is plotted as a function of extracellular Na+ concentration; the straight line is the prediction from Scheme 2. (D) Voltage dependence of KD at negative voltages. The value of Z was obtained from fits of Eq. 2 to the data in (B) from −120 to −20 mV. The continuous line is the prediction from Scheme 2. Parameters are given in Table 1.
FIGURE 5
FIGURE 5
TBA does not affect TRPV1 single-channel conductance. (A, left) Single-channel recordings of TRPV1 activated by 4 μM capsaicin at 60 mV. The symbols O and C represent the open and closed current level, respectively. The right panel shows an all-points histogram (gray line) obtained from 30 traces as in the ones on the left; superimposed is the fit to a sum of two Gaussian functions (black line). The open level amplitude is 6 pA. (B) The patch in (A) was exposed to 250 μM TBA. The current traces were recorded also at 60 mV. Individual blocking events are discernible in the current trace as short-lived shut events. The all-points histogram from 25 traces is shown on the right with the fit to a sum of two Gaussians with open amplitude of 5.9 pA.
FIGURE 6
FIGURE 6
Kinetics of TBA block. (A) Currents recorded at the indicated membrane potential in the absence (left) and presence of 250 μM TBA (right). The onset of channel block is evidenced by the exponential current decay. (B) Recovery from channel block at negative voltages in the presence of 250 μM TBA. The patch was stepped to 60 mV and repolarized to record tail currents from −100 mV to −20 mV. The exponential increase of current is due to voltage-dependent unbinding of TBA from the channel. The trace at −100 mV is shown as a thick black line and reflects both unblocking and deactivation of the channel. (C) Voltage dependence of on- and off-rate constants. The off-rate constant koff was obtained from fits of a single exponential to records as in (B) and for kon, the inverse of the time constant of an exponential fitted to the current decay of records as in A (right) was plotted as a function of TBA concentration, and the slope used as an estimate of kon. The values of koff and kon as a function of voltage were fitted with an exponential function of voltage (Eq. 4) with parameters: kon(0) = 2.5 × 10⁵ M−1s−1, koff(0) = 83.76s−1, zon = 0.93 and zoff = −0.63. Symbols are the mean ± SE (n = 4).
FIGURE 7
FIGURE 7
State dependence of block by intracellular TBA. (A) Individual channel openings from a patch with 150 channels in the presence of 10 nM capsaicin. The open probability obtained from the ensemble-averaged idealized traces at 100 mV is 0.016. (B) Macroscopic currents elicited by the indicated concentration of capsaicin in the same patch as in (A). (C) Block of TRPV1 channels by TBA. The solid circles are the open probability in response to capsaicin obtained from dose responses as in (A) and (B). Open circles are the open probability in the presence of 250 μM TBA in the same patch. The square symbol is the value of the unliganded open probability determined from separate patches. The continuous line represents the prediction of Scheme 3 in the absence of blocker. The dotted curve is the prediction of Scheme 3, which allows block in the open state only. The parameters of the model are given in Table 2. (D) Fraction of blocked channels, fB,, as a function of capsaicin concentration. Data were transformed according to 1−(PB/P), where P is the open probability in the absence of blocker and PB is the open probability with blocker. The continuous curve is the prediction of Scheme 3 with the same parameters as in C. Symbols are the mean ± SE (n = 3).
FIGURE 8
FIGURE 8
Burst kinetics support an open-state block mechanism. (A) TRPV1 channel burst kinetics. Upper panel shows bursts of openings at 60 mV in the presence of 10 nM capsaicin in a patch containing ∼120 channels. The closed and open channel levels are indicated. Rare openings of a very small conductance channel are also visible. The lower panel shows traces recorded in the same patch and under the same conditions as in the upper panel but in the presence of 250 μM TBA. (B) Burst-length distributions of the patch in (A). The upper panel shows the burst-length distribution in the absence of blocker. The lower panel shows the burst length distribution in 250 μM TBA. The continuous lines are the prediction of the burst length from Scheme 3 with the parameters shown in Table 2.
SCHEME 3
SCHEME 3
Full model for open-state block.
FIGURE 9
FIGURE 9
Closure kinetics of TRPV1 channels are affected by TBA. Tail currents of channel activated by 4 μM capsaicin and a voltage pulse to 60 mV in the absence of blocker are shown as the black trace for a tail voltage of −40 (A) and a tail voltage of −100 mV (C). Tail currents were also recorded in the presence of 250 μM (gray traces) or 2.5 mM TBA (light gray traces) for each voltage. (B and D) Simulations of tail currents for each condition shown in (A) and (C) were performed according to the open-channel block mechanism shown in Scheme 3. The rate constants for block at 0 mV and the voltage dependences of the blocking rate constants used for tail-current modeling were obtained from measurement of blocking kinetics (kon and koff) as shown in Fig. 6. All model parameters are shown in Table 2. The lines of panels (B) and (D) represent the model predictions for the same conditions used in (A) and (C). The model shown here does not include any mechanism for saturation of block and thus predicts more block than observed.

Similar articles

Cited by

References

    1. Minke, B. 1977. Drosophila mutant with a transducer defect. Biophys. Struct. Mech. 3:59–64. - PubMed
    1. Clapham, D. E., L. W. Runnels, and C. Strubing. 2001. The TRP ion channel family. Nat. Rev. Neurosci. 2:387–396. - PubMed
    1. Montell, C. 2001. Physiology, phylogeny, and functions of the TRP superfamily of cation channels. Sci. STKE. 2001:RE1. - PubMed
    1. Montell, C., L. Birnbaumer, V. Flockerzi, R. J. Bindels, E. A. Bruford, M. J. Caterina, D. E. Clapham, C. Harteneck, S. Heller, D. Julius, I. Kojima, Y. Mori, R. Penner, D. Prawitt, A. M. Scharenberg, G. Schultz, N. Shimizu, and M. X. Zhu. 2002. A unified nomenclature for the superfamily of TRP cation channels. Mol. Cell. 9:229–231. - PubMed
    1. Caterina, M. J., M. A. Schumacher, M. Tominaga, T. A. Rosen, J. D. Levine, and D. Julius. 1997. The capsaicin receptor: a heat-activated ion channel in the pain pathway. Nature. 389:816–824. - PubMed

Publication types

MeSH terms

LinkOut - more resources