. 2007 Apr;9(4):470-8.
doi: 10.1038/ncb1559. Epub 2007 Mar 18.

Oestrogen signalling inhibits invasive phenotype by repressing RelB and its target BCL2

Affiliations

Oestrogen signalling inhibits invasive phenotype by repressing RelB and its target BCL2

Xiaobo Wang et al. Nat Cell Biol. 2007 Apr.

Abstract

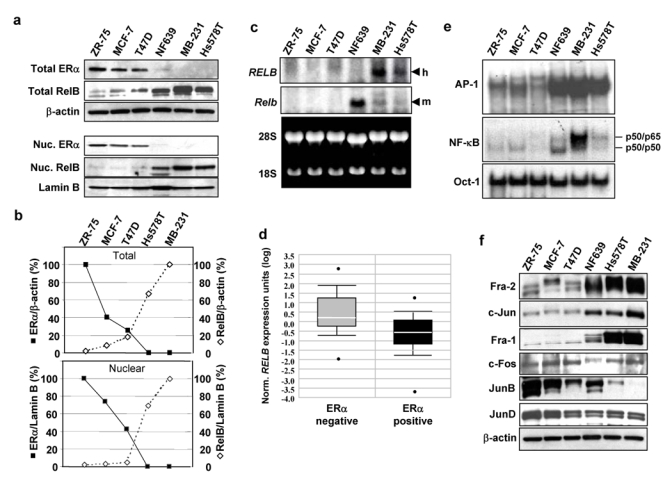
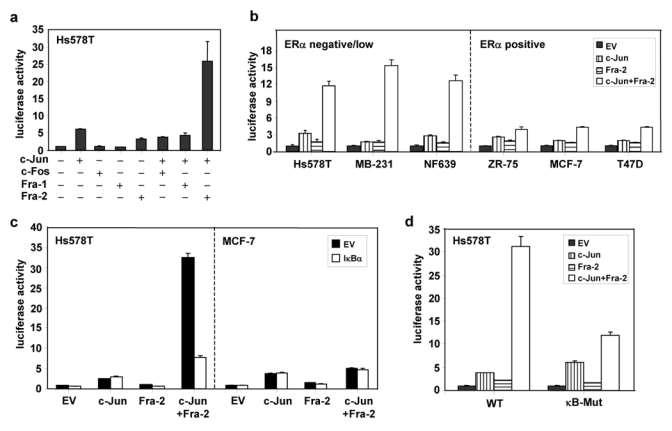
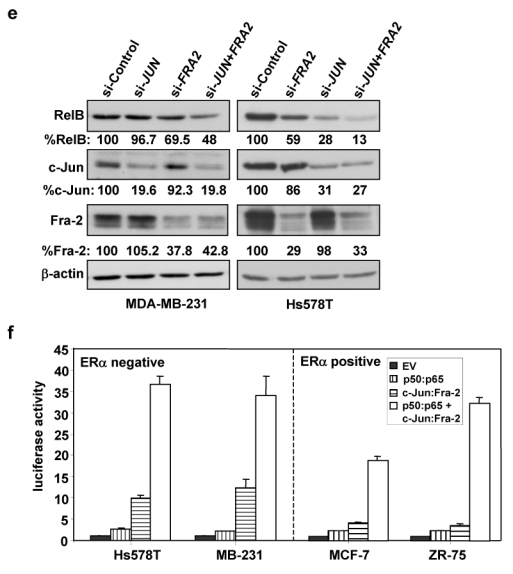
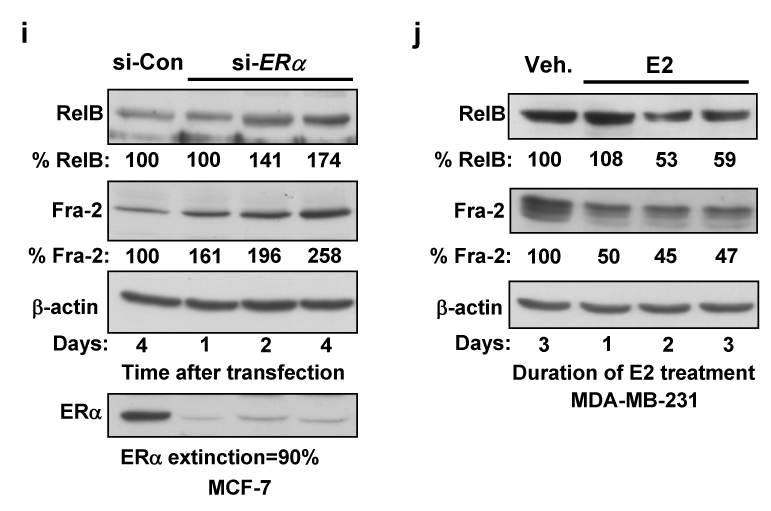
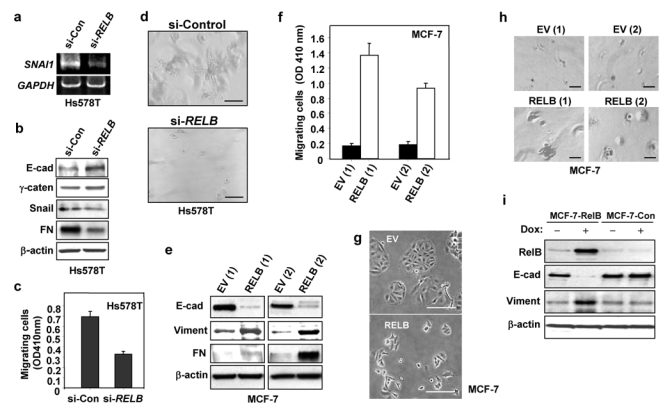
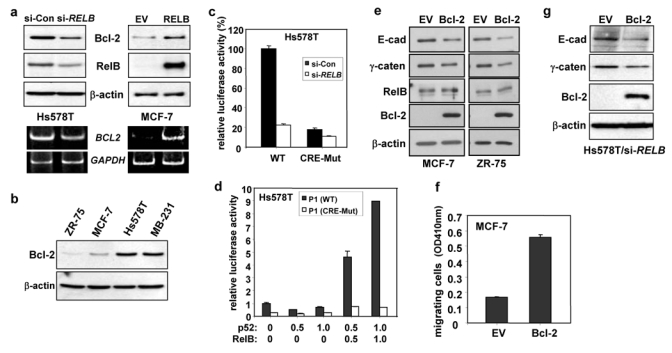
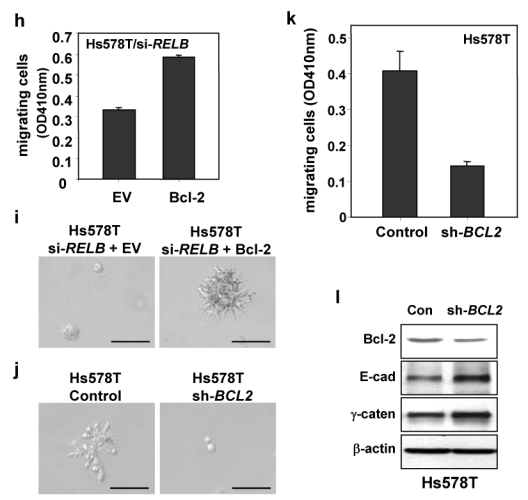
Aberrant constitutive expression of c-Rel, p65 and p50 NF-kappaB subunits has been reported in over 90% of breast cancers. Recently, we characterized a de novo RelB NF-kappaB subunit synthesis pathway, induced by the cytomegalovirus (CMV) IE1 protein, in which binding of p50-p65 NF-kappaB and c-Jun-Fra-2 AP-1 complexes to the RELB promoter work in synergy to potently activate transcription. Although RelB complexes were observed in mouse mammary tumours induced by either ectopic c-Rel expression or carcinogen exposure, little is known about RelB in human breast disease. Here, we demonstrate constitutive de novo RelB synthesis is selectively active in invasive oestrogen receptor alpha (ERalpha)-negative breast cancer cells. ERalpha signalling reduced levels of functional NF-kappaB and Fra-2 AP-1 and inhibited de novo RelB synthesis, leading to an inverse correlation between RELB and ERalpha gene expression in human breast cancer tissues and cell lines. Induction of Bcl-2 by RelB promoted the more invasive phenotype of ERalpha-negative cancer cells. Thus, inhibition of de novo RelB synthesis represents a new mechanism whereby ERalpha controls epithelial to mesenchymal transition (EMT).


Figures

Figure 1
Figure 1. RelB levels are inversely correlated with ERα status in breast cancer cells. (a)
Upper panel. WCEs (25 μg) from the indicated breast cancer cells were analyzed by immunoblotting with antibodies against ERα, RelB, and β-actin, which confirmed equal loading. Lower panel. Nuclear extracts (25 μg) from the indicated breast cancer cells were analyzed by immunoblotting for ERα, RelB and Lamin B. MB-231, MDA-MB-231. (b) The blots for the human cell lines in (a) were scanned and the values for ERα and RelB normalized to β-actin (upper panel) or to Lamin B (lower panel) plotted as a percent of the values in ZR-75 and MDA-MB-231 cells, respectively (set at 100%), showing an inverse relationship between these two proteins. (c) Samples of mRNA (20 μg) were subjected to Northern blot analysis using either human RELB (h) or mouse Relb (m) cDNA, as probe, as they only weakly hybridize across species. Ethidium bromide staining confirmed equal loading. In RT-PCR analysis, RELB mRNA levels in ZR-75, MCF-7, T47D, and Hs578T cells were 3.9%, 16.0%, 19.2%, and 57.2% of those seen in MDA-MB-231 cells (not shown). (d) Box plots of data from the Van de Vijver_Breast carcinoma microarray dataset (reporter number NM_0065096) was accessed using the ONCOMINE Cancer Profiling Database (www.oncomine.org) and is plotted on a log scale. The dataset includes 69 ERα negative and 226 ERα positive human primary breast carcinoma samples. A Student t-test, performed directly through the Oncomine 3.0 software, showed the difference in RELB expression between the two groups was significant (p-value = 3.9 e-11). (e) Nuclear extracts (5 μg) were subjected to EMSA binding of AP-1, NF-κB, or Oct-1, which confirmed equal loading. The positions of the previously identified p50/p50 and p50/p65 NF-κB complexes in Hs578T cells are as indicated. (f) Nuclear extracts (25 μg) were analyzed for Fra-2, c-Jun, Fra-1, c-Fos, JunB, JunD, or β-actin. Uncropped scans of the top two panels in a and e are shown in the Supplementary Information, Fig. S5a and S5b, respectively.
Figure 2
Figure 2. c-Jun/Fra-2 AP-1 and p50/p65 NF-κB complexes synergistically induce RELB promoter activity in ERα negative breast cancer cells
(a) Hs578T cells were transiently transfected, in triplicate, with 0.5 μg p1.7 RELB promoter-Luc vector, 0.5 μg of the indicated AP-1 subunit expression vector, 0.5 μg SV40-β-gal and empty vector (EV) pcDNA3 to make a total of 3.0 μg DNA. Post-transfection (48 h), luciferase and β-gal activities were determined and normalized luciferase activities presented (mean ± S.D. from three separate experiments). (b) The indicated breast cancer cell lines were transiently transfected with 1.0 μg p1.7 RELB promoter-Luc vector, 0.5 μg c-Jun and Fra-2 AP-1 subunit expression vector, 0.5 μg SV40-β-gal and EV DNA to a 3.0 μg DNA total, and analyzed as in (a). (c) Hs578T or MCF-7 cells were transiently transfected with 0.5 μg p1.7 RELB promoter-Luc DNA, 0.5 μg of the indicated AP-1 subunit expression vector, in the absence or presence of 0.5 μg IκB-α vector DNA, 0.5 μg SV40-β-gal and EV DNA to a 3.0 μg DNA total, and processed as above. (d) Hs578T cells were transiently transfected with 0.5 μg of WT or κB-mutant p1.7 RELB promoter-Luc vector, AP-1 subunit, SV40-β-gal and EV DNA and analyzed as in (a). (e) MDA-MB-231 or Hs578T cells were transfected with siRNA directed against JUN or FRA2, or against both genes. All duplexes were used at a concentration of 100 nM and 100 nM GFP siRNA was added when only one gene was targeted. Post-transfection (48 h), WCEs were analyzed by immunoblotting for RelB, c-Jun, Fra-2, and β-actin. (Please note loading for si-JUN and si-FRA2 was reversed in the two blots.) The blots were scanned and the values for RelB, c-Jun, and Fra-2 normalized to β-actin. Values relative to the control siRNA (set at 100%) are given below each lane, showing their corresponding levels of decrease. (f) The indicated breast cancer cell lines were transiently transfected with 0.5 μg p1.7 RELB promoter-Luc vector, 0.25 μg of the indicated AP-1 or NF-κB subunit expression vectors, 0.5 μg SV40-β-gal and EV DNA to a 3.0 μg DNA total, and analyzed as in (a).
Figure 3
Figure 3. ERα represses NF-κB and AP-1 activities and reduces RelB levels
(a–b) MCF-7 cells were treated with 1 μM ICI 182,780 (ICI) or vehicle ethanol (Eth) for 48 h. (a) WCEs (25 μg) were analyzed by immunoblotting (left panel). RNA was subjected to Northern blotting and ethidium bromide staining (right panel). (b) Nuclear extracts were subjected to EMSA, as in Fig. 1e. (c) MCF-7 cells were transiently transfected, in triplicate, with 0.5 μg NF-κB (κB-Luc) or AP-1 (TRE-CAT) element driven constructs and 0.5 μg SV40-β-gal. Post-transfection (6 h), cells were treated with ICI 182,780 or ethanol for 40 h. Normalized values are presented as the mean ± S.D. from three experiments (control set to 1). (d) MCF-7 cells were transfected with si-ERα or GFP control siRNA. After 3 successive 48 h transfections, WCEs were analyzed by immunoblotting. (e) Cells, growing in medium depleted of steroids, were transfected with 10 μg ERα expression vector or EV DNA for 6 h and then treated for 40 h with 10 nM E2. WCEs were analyzed by immunoblotting. (f) Cells in steroid-free medium were transfected, in triplicate, with 0.5 μg of the indicated p1.7 RELB promoter-Luc vector, 1 μg ERα expression vector or EV pcDNA3, 0.5 μg SV40-β-gal, and EV DNA (3.0 μg total). After 6 h, cells were treated for 40 h with 10 nM E2. Normalized data are presented relative to the WT reporter with EV DNA (mean ± S.D from three experiments). (g) WCEs from MCF-7 cells, treated as in part a, were analyzed by immunoblotting. (h) MDA-MB-231 and Hs578T cells, transfected with an ERα expression or EV DNA, were processed as in part e. (i) MCF-7 cells, transfected with si-ERα or control siRNA, were lysed after 1, 2 or 4 days and WCEs analysed. Values for RelB and Fra-2 normalized to β-actin relative to control (set at 100%) are presented below. (j) Stable MDA-MB-231 cells expressing ERα, cultivated in medium depleted of steroids, were treated with 10 nM E2 as indicated. Values for RelB and Fra-2 normalized to β-actin in WCEs, relative to control, are given.
Figure 4
Figure 4. RelB expression promotes mesenchymal phenotype of breast cancer cells
(a–d) Stable Hs578T transfectants expressing either siRNA RELB (Hs578T/si-RELB) or sense RELB (Hs578T/si-Control) (si-Con) were prepared. Expression of si-RELB decreased levels of RELB mRNA and RelB protein in the nucleus, but had no effect on levels of the p65 NF-κB subunit (see Supplementary Information, Figs. S1b1 and S1b2), consistent with findings of Johansen and coworkers. (a) RNA was analyzed by RT-PCR for levels of SNAI1 and GAPDH RNA, as a control for equal loading. (b) WCEs (50 μg) were analyzed by immunoblotting for E-cadherin, γ-catenin, Snail, fibronectin (FN), and β-actin. The effects of si-RELB on MDA-MB-231 cells were tested and similar data were obtained (see Supplementary Information, Fig. S1c). (c) Cells were subjected, in triplicate, to a migration assay for 4 h. Cells that migrated to the lower side of the filter quantified by spectrometric determination at OD410nm (mean ± S.D). Data presented are from one representative of 3 experiments. (d) Cells were subjected to Matrigel outgrowth analysis. After 5 days, the colonies were photographed (50× magnification). (e–h) Stable MCF-7 clones expressing either RELB or EV DNA were isolated: RELB(1), RELB(2), EV(1), and EV(2). Ectopic RelB expression increased NF-κB reporter activity, and levels of cyclin D1, but failed to alter the levels of p65 (see Supplementary Information, Figs. S2a and S2b). (e) WCEs were subjected to immunoblot analysis for E-cadherin (E-cad), fibronectin (FN), vimentin (Viment), and β-actin. While all of the clones showed an increase in fibronectin, the extent of the increase varied. (f) Clones were subjected to a migration assay, as in part (c) (mean ± S.D from three separate experiments). (g) MCF-7 stable clones (1×10⁴ cells ml−1) were plated and after 2 days photographed (50× magnification). (h) Clones were subjected to Matrigel outgrowth analysis. After 15 days of growth, the colonies were photographed (50× magnification). (i) Stable MCF-7 cells with an inducible RelB expression vector were treated with 1 μg/ml doxycyline. After 48 h, WCEs were subjected to immunoblot analysis for RelB, E-cadherin (E-cad), vimentin and β-actin, as above. Scale bar, 100 μm in parts d, g, and h. An uncropped scan of the E-cadherin panel in i is shown in the Supplementary Information, Fig. S5c.
Figure 5
Figure 5. Bcl-2 mediates control of invasive properties of breast cancer cells
(a) WCEs (25 μg) and RNA were prepared from Hs578T/si-RELB or Hs578T/si-Control and from MCF-7 cells expressing RELB (clone 1) or with EV DNA, and analyzed by immunoblotting (Upper panels), and RT-PCR (Lower panels). Similar data were obtained with other MCF-7 clones expressing RELB (not shown). (b) ZR-75, MCF-7, Hs578T and MDA-MB-231 WCEs (25 μg) were analyzed for Bcl-2 and β-actin. (c) Hs578T cells were transiently transfected with 0.5 μg WT or CRE-Mutant BCL2 P1 promoter-Luc vector, 1.0 μg of the siRNA RELB expression or control sense vector (si-Con), 0.5 μg SV40-β-gal and EV pcDNA3 (3.0 μg DNA total) for 48 h. Normalized luciferase activities are presented (mean ± S.D. from three separate experiments). (d) Hs578T cells were transiently transfected, in triplicate, with 1.0 μg WT or CRE-Mutant BCL2 P1 promoter-Luc vector, the indicated dose of p52 and RelB expression vectors, 0.5 μg SV40-β-gal and EV pcDNA3 (3.5 μg DNA total), and analyzed as in (c). (e) WCEs (25 μg) were prepared from MCF-7 and ZR-75 cells, ectopically expressing EV or full length Bcl-2, and analyzed for EMT gene expression, Bcl-2, and RelB, as above. Ectopic Bcl-2 also resulted in a substantial decrease in E-cadherin staining in MCF-7 cells (see Supplementary Information, Fig. S4) (f) Stable mixed populations of MCF-7 cells expressing Bcl-2 or EV DNA were subjected to a migration assay for 24 h, as in Fig 4c. (g) WCEs (50 μg) were prepared from Hs578T/si-RELB cells, ectopically expressing full length Bcl-2, and analyzed, as above. (h–i) Hs578T/si-RELB cells were transiently infected with pBABE-Bcl-2 or EV pBABE DNA. After 24 h, cells were subjected to a migration assay for 4 h (h), or Matrigel colony formation assay for 12 days (i). (jl) Hs578T cells were infected with pSM2c-sh-BCL2 or scrambled control (Control). (j) Cells were subjected to Matrigel assay in the presence of 2 μg/ml puromycin. (k) Stable mixed populations, isolated using puromycin selection, were subjected to a migration assay for 4 h. (l) WCEs (25 μg) were assessed by immunoblotting. Scale bar, 100 μm in parts i and j.

Comment in

Similar articles

Cited by

References

    1. Nakshatri H, Bhat-Nakshatri P, Martin DA, Goulet RJ, Jr, Sledge GW., Jr Constitutive activation of NF-kappaB during progression of breast cancer to hormone-independent growth. Mol Cell Biol. 1997;17:3629–39. - PMC - PubMed
    1. Sovak MA, et al. Aberrant nuclear factor-kappaB/Rel expression and the pathogenesis of breast cancer. J Clin Invest. 1997;100:2952–60. - PMC - PubMed
    1. Wang X, Sonenshein GE. Induction of the RelB NF-kappaB subunit by the cytomegalovirus IE1 protein is mediated via Jun kinase and c-Jun/Fra-2 AP-1 complexes. J Virol. 2005;79:95–105. - PMC - PubMed
    1. Romieu-Mourez R, et al. Mouse mammary tumor virus c-rel transgenic mice develop mammary tumors. Mol Cell Biol. 2003;23:5738–54. - PMC - PubMed
    1. Demicco EG, et al. RelB/p52 NF-kappaB complexes rescue an early delay in mammary gland development in transgenic mice with targeted superrepressor IkappaB-alpha expression and promote carcinogenesis of the mammary gland. Mol Cell Biol. 2005;25:10136–47. - PMC - PubMed

Publication types

MeSH terms