. 2007 Apr;10(4):494-504.
doi: 10.1038/nn1877. Epub 2007 Mar 18.

Functional dissection of circuitry in a neural integrator

Affiliations

Functional dissection of circuitry in a neural integrator

Emre Aksay et al. Nat Neurosci. 2007 Apr.

Erratum in

  • Nat Neurosci. 2007 Jun;10(6):798

Abstract

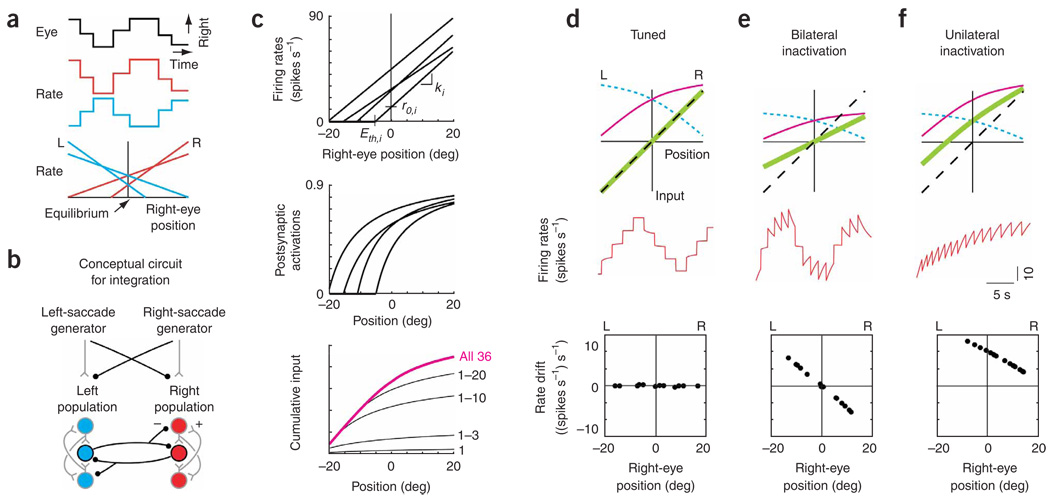
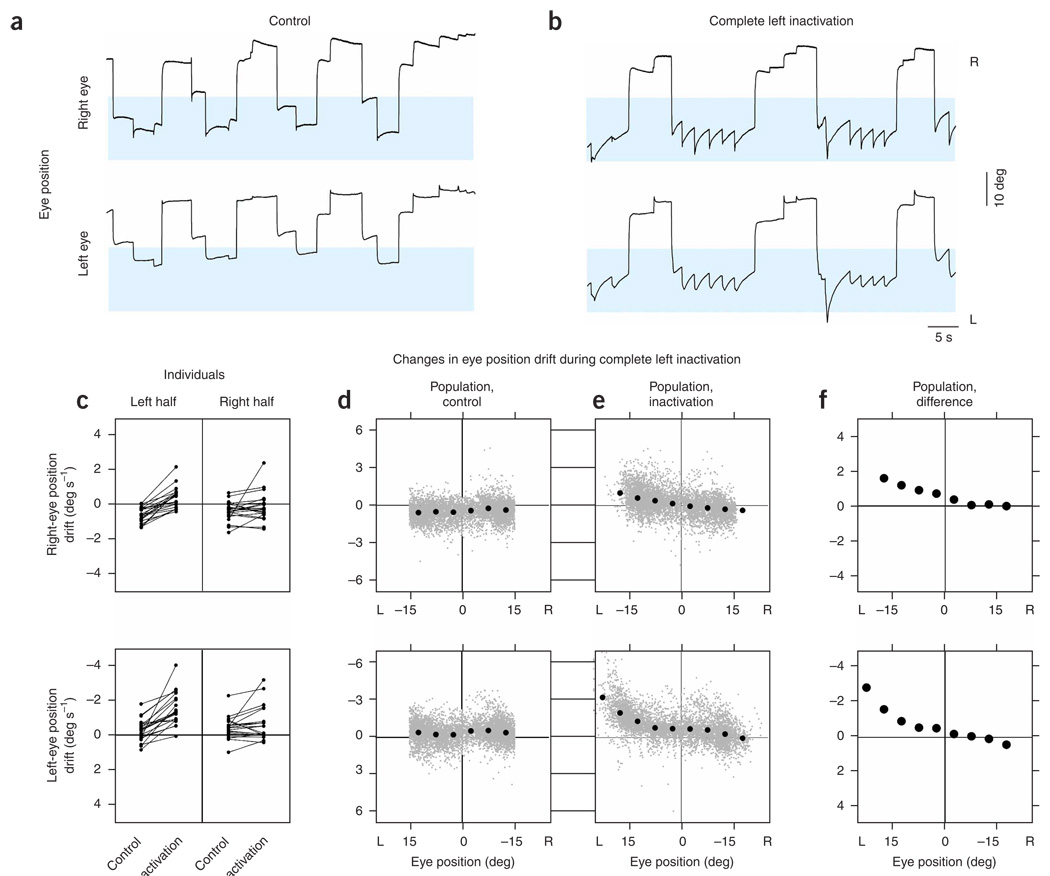
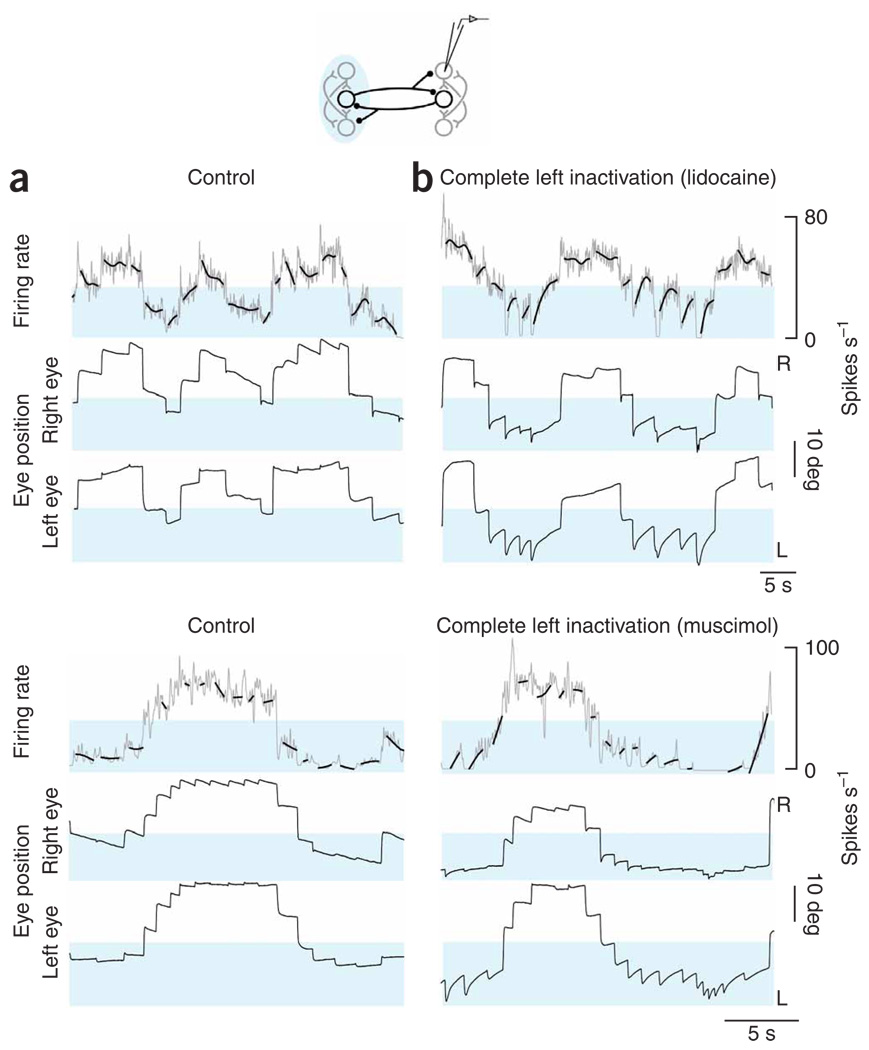
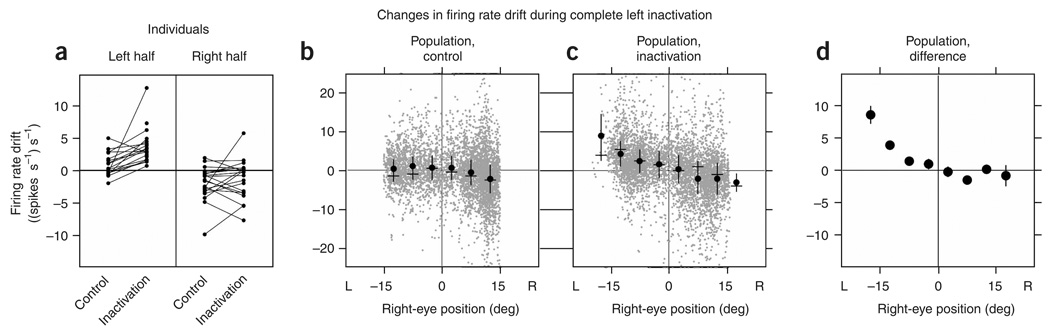
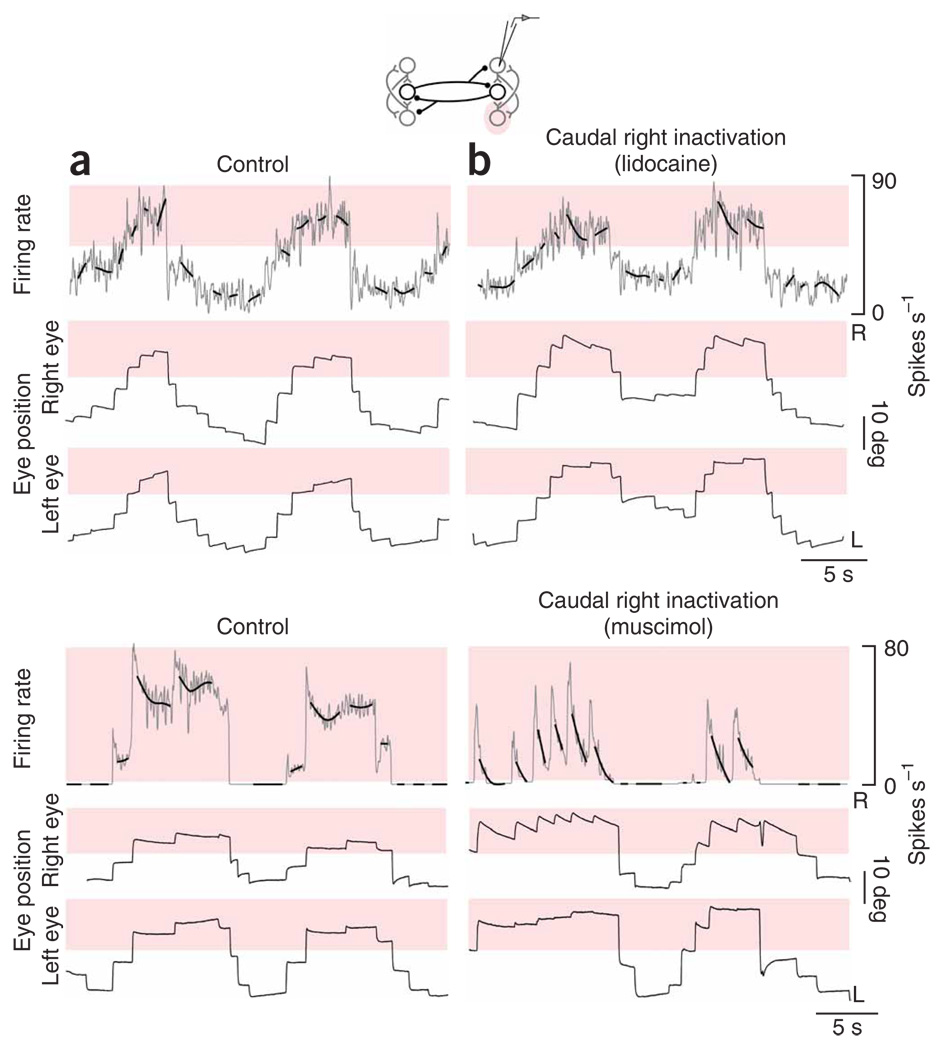
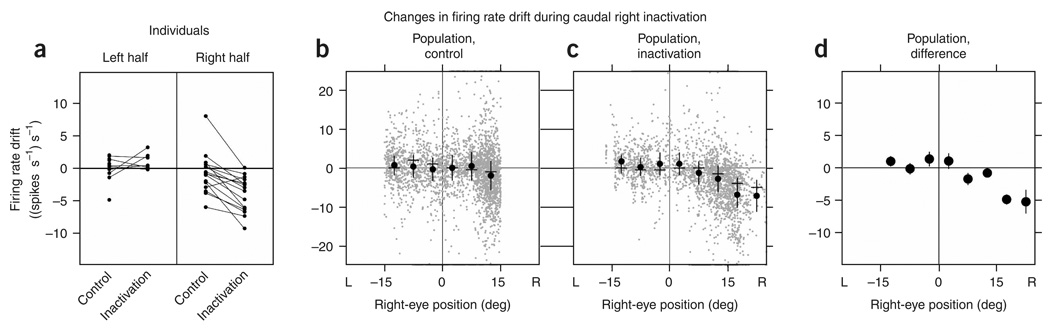
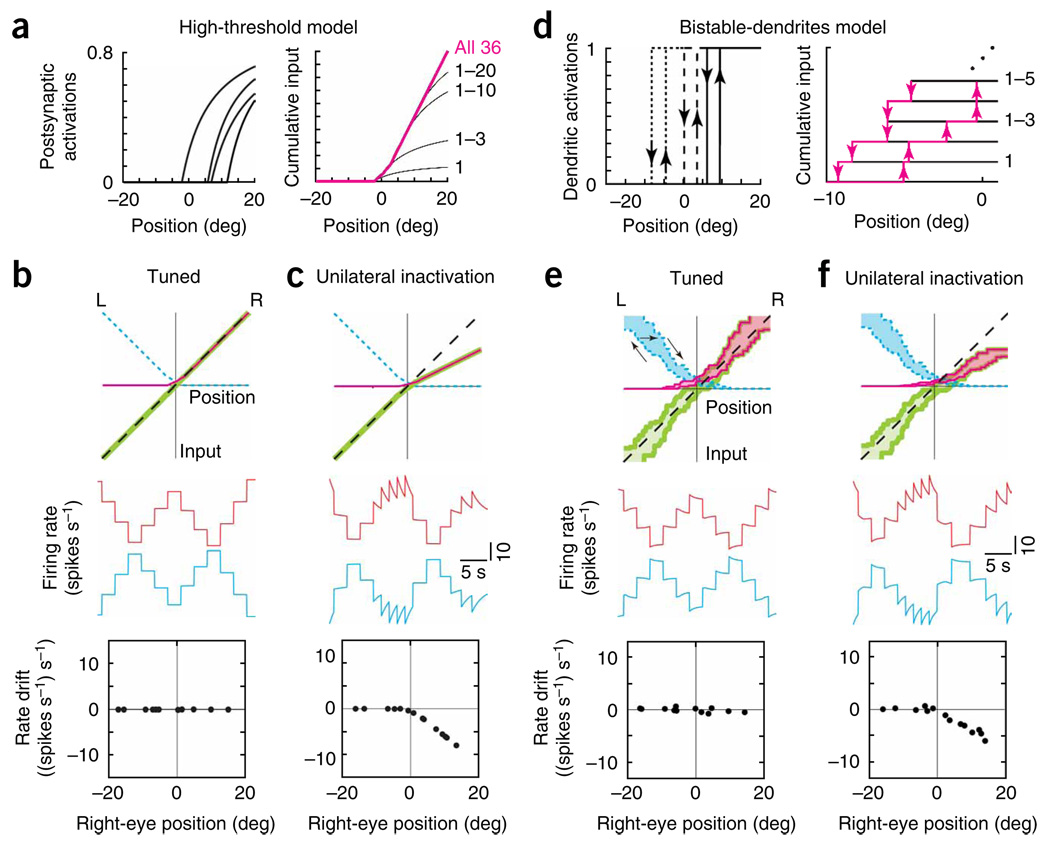
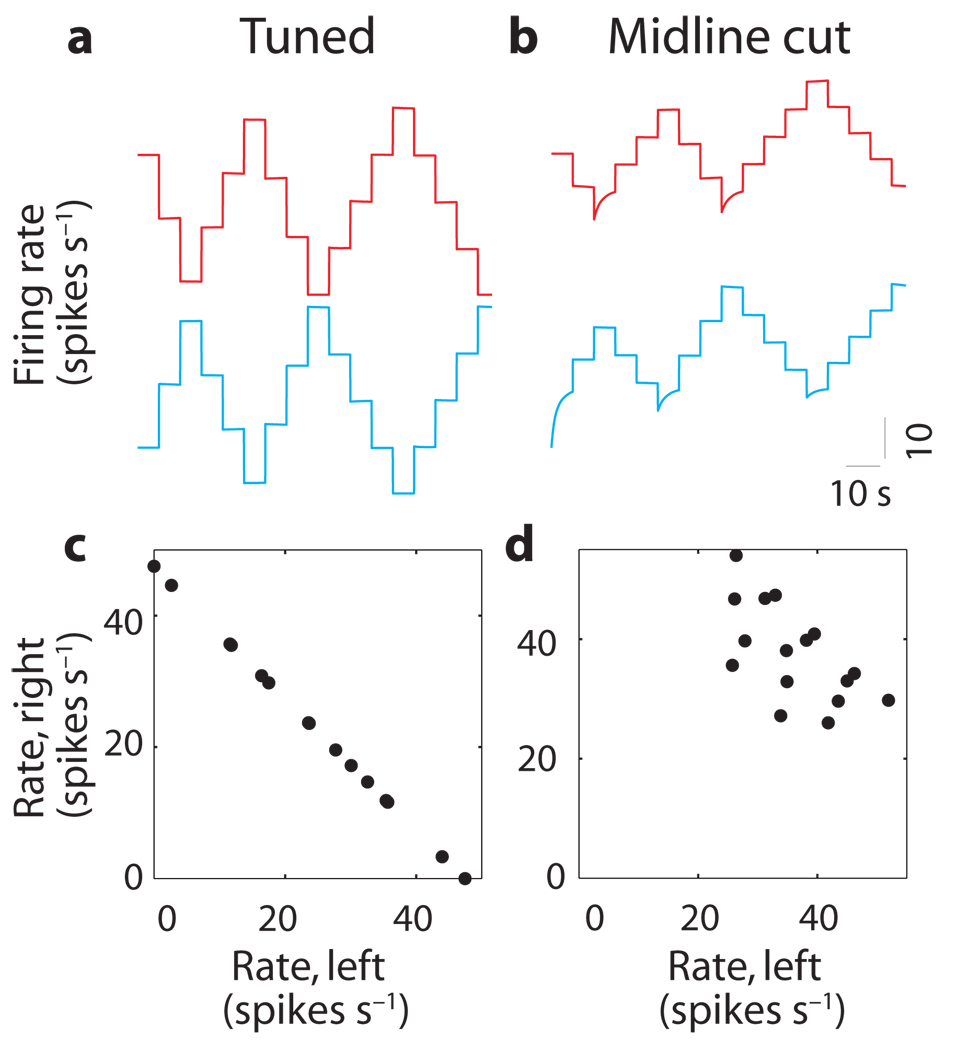
In neural integrators, transient inputs are accumulated into persistent firing rates that are a neural correlate of short-term memory. Integrators often contain two opposing cell populations that increase and decrease sustained firing as a stored parameter value rises. A leading hypothesis for the mechanism of persistence is positive feedback through mutual inhibition between these opposing populations. We tested predictions of this hypothesis in the goldfish oculomotor velocity-to-position integrator by measuring the eye position and firing rates of one population, while pharmacologically silencing the opposing one. In complementary experiments, we measured responses in a partially silenced single population. Contrary to predictions, induced drifts in neural firing were limited to half of the oculomotor range. We built network models with synaptic-input thresholds to demonstrate a new hypothesis suggested by these data: mutual inhibition between the populations does not provide positive feedback in support of integration, but rather coordinates persistent activity intrinsic to each population.


Figures

Figure 1
Figure 1. Traditional model of feedback for opposing populations
(a) Schematic of spontaneous saccadesand fixations accompanying changes in the firing rate of two integrator neurons, and typical relationships between rate and eye position for two right-side (R) neurons (red) and two left-side (L) neurons (blue), (b) Conceptual circuit for an integrator with opposing left and right populations which transforms brief eye velocity commands from saccade generators into sustained eye position commands (black, inhibitory interactions; gray, excitatory). Projections carrying tonic background signals are not shown. (c) Construction of the cumulative input from the right population. Top, fits to experimental relationships between firing rate and eye position for four neurons. The lines were characterized by slopes ki and equilibrium rates r0,i, which set the model neuron gains and tonic background inputs. Eth,i, eye position threshold for recruitment of cell i. Middle, model postsynaptic activations provided by the presynaptic neuronal firing rates above (see Methods). Bottom, cumulative input (magenta) at different positions is given by a weighted sum of the individual activations, with weights fit to satisfy the tuning condition of equation (10). Black traces, intermediate sums calculated from the contributions of the first n = 1,3,10,20 recruited neurons. (d–f) Firing rate dynamics in tuned (d) and disrupted (bilateral, e; unilateral, f) networks. Top, stable positions are maintained wherever the total feedback (green), given by the difference between the inputs from the right (magenta) and left (blue, short dashes) populations, intersects the line representing the perfect-tuning condition (black, dashed; equation (10)). Middle, firing rate of a right-side cell. Bottom, drift in rate during fixations at different eye positions.
Figure 2
Figure 2. Eye position after inactivation of one population
(a,b) Right and left eye positions versus time before (a) and after (b) complete inactivation of the left population. Blue shading highlights positions where the greatest changes of eye drift during fixations were seen with inactivation. Control and inactivation positions are shown with the same scale and origin. This control was taken after recovery from two prior inactivations. (c) Drift of eye position in the left and right oculomotor-range halves, for individual experiments, during control and inactivation (top, right eye; bottom, left eye). Points falling in the upper half of each panel indicate eye drift to the right. Corresponding data points from an individual experiment are connected by a line. (d,e) For the population, drift of eye position at different positions during the control (d) and inactivation (e) conditions. Gray points correspond to samples over 0.3 s during a fixation, and black points to averages of the gray ones in bins of 5 deg. Gray points on the horizontal boundary of the graph are from data where the drifts exceeded the limits shown; gray points on the vertical boundary are from data where the positions exceeded the limits shown. (f) Difference of the mean inactivation from mean control data. The 95% confidence intervals did not extend beyond the diameter of a point.
Figure 3
Figure 3. Firing rates in the right population after inactivation of the left
(a,b) Neuronal panels, firing rates versus time of right-side cells at fine (gray) and coarse (bold black, smoothing spline) resolution before (a) and after (b) complete inactivation of the left population (top, lidocaine; bottom, muscimol). Blue shading highlights firing rates where the greatest changes of rate drift during fixations were seen with inactivation. Control and inactivation rates are shown with the same scale and origin. Eye panels, as in Figure 2a,b. Both controls were taken after recovery from one prior inactivation.
Figure 4
Figure 4. Analysis of rate drift after complete left inactivation
(a) Mean drift in firing rate when the eyes were in each half of the oculomotor range for individual experiments recording from right-side cells during control and inactivation. Data points below zero of the ordinate indicate times when firing rate was decreasing, and points in the upper half indicate times when rate was increasing. Corresponding data points from an individual experiment are connected by a line. (b,c) Rate drift at different positions during the control (b) and inactivation (c) conditions for the population. Gray points correspond to samples over 0.3 s during a fixation; black points, dashes and vertical bars correspond to means, modes and twice the s.d., respectively, of the gray data points in bins of 5 deg. Data on perimeter as in Figure 2d,e. (d) Difference of the average inactivation from average control data over separate bins. Vertical black segments are 95% confidence intervals, many of which fell within the diameter of point.
Figure 5
Figure 5. Firing rates in the right population after inactivation of caudal neurons
(a,b) Neuronal panels, firing rates versus time of rostral right-side cells at fine (gray) and coarse (bold black) resolution before (a) and after (b) inactivation of caudal cells in the right population (top, lidocaine; bottom, muscimol). Red shading highlights firing rates where the greatest changes of rate drift during fixations were seen with inactivation. Eye panels, as in Figure 2a,b. No prior inactivations occurred before the control in this lidocaine experiment. The control in this muscimol experiment was taken after recovery from one prior inactivation. Note that the cell in this muscimol experiment had a high threshold, so that when active it almost always fired above its equilibrium rate.
Figure 6
Figure 6. Analysis of rate drift after caudal inactivation
(a) Rate drift in separate oculomotor-range halves during control and caudal right inactivation for individual experiments. (b,c) Rate drift at different positions during the control (b) and inactivation (c) conditions for the population. Gray points correspond to samples over 0.3 s during a fixation; black points, dashes and vertical bars correspond to means, modes and twice the s.d., respectively, of the gray data points in bins of 5 deg. Data on perimeter as in Figure 2d,e. (d) Difference of the average inactivation from average control data. Vertical black segments are 95% confidence intervals, some of which fell within the diameter of point.
Figure 7
Figure 7
Models with activation thresholds can explain the asymmetric effects of unilateral inactivations. Panel features are as in Figure 1c,d,f. (a–c) Asymmetric effects of unilateral disruption in the high-threshold model, (a) Left, activation functions provided by the right-side neurons of Figure 1c when their firing rates had to cross a high threshold to trigger a postsynaptic response. Right, with this high threshold, cumulative input from the right population is significant only in the right half of the position range. Neurons are arranged by order of synaptic activation. (b,c) Top, total inputs (magenta, right; blue dashed, left; green, difference) in the tuned (b) and 50% unilaterally reduced (c) conditions. Middle, firing rates versus time of a right-side (red) and left-side (blue) cell. The rates are offset by 40 spikes s−1 vertically. Bottom, drift in rate of the right-side cell. (d–f) Similar asymmetry following unilateral disruption (50%) of the bistable-dendrites model. (d) Left, activations provided by 3 of the right-side neurons of Figure 1c when bistable dendrites are introduced. Localized plateaus turn on (up arrows) in a postsynaptic neuron when the presynaptic neuron's firing rate exceeds a threshold value, and turn off (down arrows) when the rate drops below a lower value. Right, cumulative input provided by the right side, shown explicitly for the first five neurons to cross the firing rate threshold required to activate their postsynaptic targets. (e,f) Recurrent input provided by each population is hysteretic (tuned, e; unilateral, f). Arrows in e (top) indicate a trajectory of the input provided by the left population as the eyes move left and then right.
Figure 8
Figure 8. Loss of coordination after loss of mutual inhibition
(a,b) Firing rates of a left-side (blue) and right-side (red) neuron before (a) and after (b) midline transection of the high-threshold model. Rates are offset by 60 spikes s−1 vertically within each panel and aligned between panels. (c,d) Rate of a left-side neuron versus rate of a right-side neuron during fixations before (c) and after (d) midline transection. Similar results were found in the bistable-dendrites model.

Similar articles

Cited by

References

    1. Taube JS, Bassett JP. Persistent neural activity in head direction cells. Cereb. Cortex. 2003;13:1162–1172. - PubMed
    1. Mazurek ME, Roitman JD, Ditterich J, Shadlen MN. A role for neural integrators in perceptual decision making. Cereb. Cortex. 2003;13:1257–1269. - PubMed
    1. Major G, Tank D. Persistent neural activity: prevalence and mechanisms. Curr. Opin. Neurobiol. 2004;14:675–684. - PubMed
    1. Lopez-Barneo J, Darlot C, Berthoz A, Baker R. Neuronal activity in prepositus nucleus correlated with eye movement in the alert cat. J. Neurophysiol. 1982;47:329–352. - PubMed
    1. McFarland JL, Fuchs AF. Discharge patterns in nucleus prepositus hypoglossi and adjacent medial vestibular nucleus during horizontal eye movement in behaving macaques. J. Neurophysiol. 1992;68:319–332. - PubMed

Publication types