

Atlas-based multichannel monitoring of functional MRI signals in real-time: automated approach
- PMID: 17370340
- PMCID: PMC6871167
- DOI: 10.1002/hbm.20377
Atlas-based multichannel monitoring of functional MRI signals in real-time: automated approach
Abstract
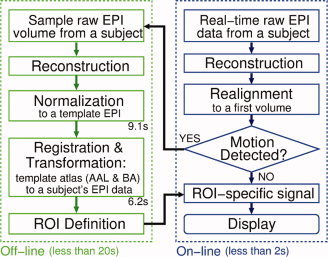
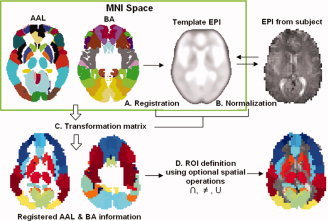
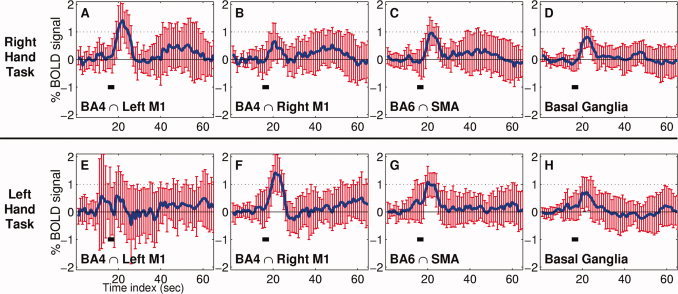
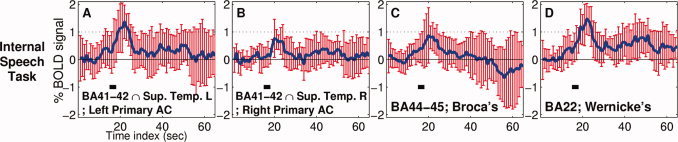
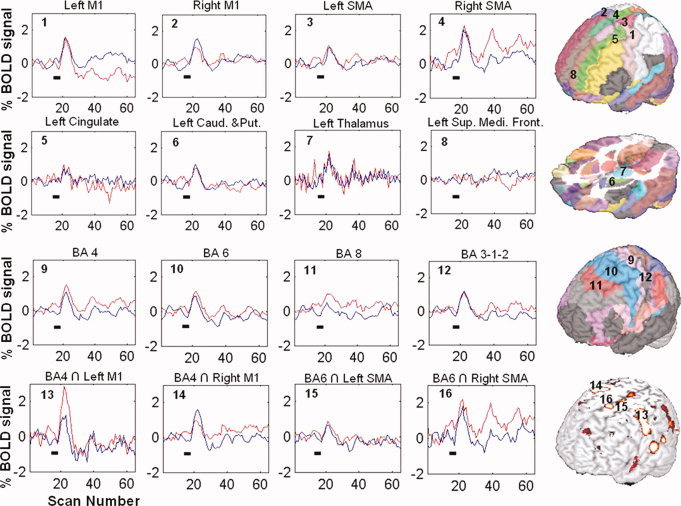
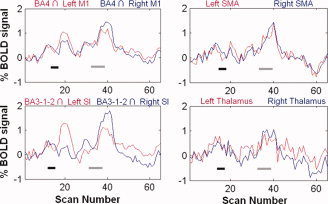
We report an automated method to simultaneously monitor blood-oxygenation-level-dependent (BOLD) MR signals from multiple cortical areas in real-time. Individual brain anatomy was normalized and registered to a pre-segmented atlas in standardized anatomical space. Subsequently, using real-time fMRI (rtfMRI) data acquisition, localized BOLD signals were measured and displayed from user-selected areas labeled with anatomical and Brodmann's Area (BA) nomenclature. The method was tested on healthy volunteers during the performance of hand motor and internal speech generation tasks employing a trial-based design. Our data normalization and registration algorithm, along with image reconstruction, movement correction and a data display routine were executed with enough processing and communication bandwidth necessary for real-time operation. Task-specific BOLD signals were observed from the hand motor and language areas. One of the study participants was allowed to freely engage in hand clenching tasks, and associated brain activities were detected from the motor-related neural substrates without prior knowledge of the task onset time. The proposed method may be applied to various applications such as neurofeedback, brain-computer-interface, and functional mapping for surgical planning where real-time monitoring of region-specific brain activity is needed.
Figures
Similar articles
-
Recording human electrocorticographic (ECoG) signals for neuroscientific research and real-time functional cortical mapping.J Vis Exp. 2012 Jun 26;(64):3993. doi: 10.3791/3993. J Vis Exp. 2012. PMID: 22782131 Free PMC article.
-
When the Brain Takes 'BOLD' Steps: Real-Time fMRI Neurofeedback Can Further Enhance the Ability to Gradually Self-regulate Regional Brain Activation.Neuroscience. 2018 May 15;378:71-88. doi: 10.1016/j.neuroscience.2016.09.026. Epub 2016 Sep 19. Neuroscience. 2018. PMID: 27659118 Free PMC article.
-
Real-time fMRI using brain-state classification.Hum Brain Mapp. 2007 Oct;28(10):1033-44. doi: 10.1002/hbm.20326. Hum Brain Mapp. 2007. PMID: 17133383 Free PMC article.
-
Feedback of real-time fMRI signals: From concepts and principles to therapeutic interventions.Magn Reson Imaging. 2017 Jan;35:117-124. doi: 10.1016/j.mri.2016.08.004. Epub 2016 Aug 25. Magn Reson Imaging. 2017. PMID: 27569365 Review.
-
Real-time fMRI and its application to neurofeedback.Neuroimage. 2012 Aug 15;62(2):682-92. doi: 10.1016/j.neuroimage.2011.10.009. Epub 2011 Oct 14. Neuroimage. 2012. PMID: 22019880 Review.
Cited by
-
Automated classification of fMRI data employing trial-based imagery tasks.Med Image Anal. 2009 Jun;13(3):392-404. doi: 10.1016/j.media.2009.01.001. Epub 2009 Jan 16. Med Image Anal. 2009. PMID: 19233711 Free PMC article.
-
Neurofeedback fMRI-mediated learning and consolidation of regional brain activation during motor imagery.Int J Imaging Syst Technol. 2008 Jun 13;18(1):69-78. doi: 10.1002/ima.20139. Int J Imaging Syst Technol. 2008. PMID: 19526048 Free PMC article.
-
Online spatial normalization for real-time FMRI.PLoS One. 2014 Jul 22;9(7):e103302. doi: 10.1371/journal.pone.0103302. eCollection 2014. PLoS One. 2014. PMID: 25050799 Free PMC article.
-
High-throughput optogenetic functional magnetic resonance imaging with parallel computations.J Neurosci Methods. 2013 Sep 15;218(2):184-95. doi: 10.1016/j.jneumeth.2013.04.015. Epub 2013 Jun 4. J Neurosci Methods. 2013. PMID: 23747482 Free PMC article.
-
Use of functional magnetic resonance imaging to identify cortical loci for lower limb movements and their efficacy for individuals after stroke.J Neuroeng Rehabil. 2024 Apr 16;21(1):58. doi: 10.1186/s12984-024-01319-8. J Neuroeng Rehabil. 2024. PMID: 38627779 Free PMC article.
References
-
- Ahonen A,Hämäläinen M,Kajola M,Knuutila J,Laine P,Lounasmaa OV,Parkkonen L,Simola J,Tesche C ( 1993): 122‐channel SQUID instrument for investigating the magnetic signals from human brain. Physica Scripta T 49: 198–205.
-
- Ashburner J,Neelin P,Collins DL,Evans A,Friston K ( 1997): Incorporating prior knowledge into image registration. Neuroimage 6: 344–352. - PubMed
-
- Bagarinao E,Matsuo K,Tanaka Y,Sarmenta LF,Nakai T ( 2005): Enabling on‐demand real‐time functional MRI analysis using grid technology. Methods Inform Med 44: 665–673. - PubMed
-
- Bartels A,Zeki S ( 2004): The chronoarchitecture of the human brain—Natural viewing conditions reveal a time‐based anatomy of the brain. Neuroimage 22: 419–433. - PubMed
Publication types
MeSH terms
Grants and funding
LinkOut - more resources
Full Text Sources
Medical
