Bayesian inverse analysis of neuromagnetic data using cortically constrained multiple dipoles
- PMID: 17370346
- PMCID: PMC6871372
- DOI: 10.1002/hbm.20334
Bayesian inverse analysis of neuromagnetic data using cortically constrained multiple dipoles
Abstract
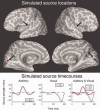
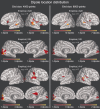
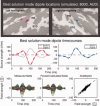
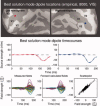
A recently introduced Bayesian model for magnetoencephalographic (MEG) data consistently localized multiple simulated dipoles with the help of marginalization of spatiotemporal background noise covariance structure in the analysis [Jun et al., (2005): Neuroimage 28:84-98]. Here, we elaborated this model to include subject's individual brain surface reconstructions with cortical location and orientation constraints. To enable efficient Markov chain Monte Carlo sampling of the dipole locations, we adopted a parametrization of the source space surfaces with two continuous variables (i.e., spherical angle coordinates). Prior to analysis, we simplified the likelihood by exploiting only a small set of independent measurement combinations obtained by singular value decomposition of the gain matrix, which also makes the sampler significantly faster. We analyzed both realistically simulated and empirical MEG data recorded during simple auditory and visual stimulation. The results show that our model produces reasonable solutions and adequate data fits without much manual interaction. However, the rigid cortical constraints seemed to make the utilized scheme challenging as the sampler did not switch modes of the dipoles efficiently. This is problematic in the presence of evidently highly multimodal posterior distribution, and especially in the relative quantitative comparison of the different modes. To overcome the difficulties with the present model, we propose the use of loose orientation constraints and combined model of prelocalization utilizing the hierarchical minimum-norm estimate and multiple dipole sampling scheme.
A recently introduced Bayesian model for magnetoencephalographic (MEG) data consistently localized multiple simulated dipoles with the help of marginalization of spatiotemporal background noise covariance structure in the analysis [Jun et al., (2005): Neuroimage 28:84–98]. Here, we elaborated this model to include subject's individual brain surface reconstructions with cortical location and orientation constraints. To enable efficient Markov chain Monte Carlo sampling of the dipole locations, we adopted a parametrization of the source space surfaces with two continuous variables (i.e., spherical angle coordinates). Prior to analysis, we simplified the likelihood by exploiting only a small set of independent measurement combinations obtained by singular value decomposition of the gain matrix, which also makes the sampler significantly faster. We analyzed both realistically simulated and empirical MEG data recorded during simple auditory and visual stimulation. The results show that our model produces reasonable solutions and adequate data fits without much manual interaction. However, the rigid cortical constraints seemed to make the utilized scheme challenging as the sampler did not switch modes of the dipoles efficiently. This is problematic in the presence of evidently highly multimodal posterior distribution, and especially in the relative quantitative comparison of the different modes. To overcome the difficulties with the present model, we propose the use of loose orientation constraints and combined model of prelocalization utilizing the hierarchical minimum‐norm estimate and multiple dipole sampling scheme. Hum Brain Mapp 2007. © 2007 Wiley‐Liss, Inc.
Wiley-Liss, Inc.
Figures


Similar articles
-
Automatic fMRI-guided MEG multidipole localization for visual responses.Hum Brain Mapp. 2009 Apr;30(4):1087-99. doi: 10.1002/hbm.20570. Hum Brain Mapp. 2009. PMID: 18465749 Free PMC article.
-
Spatiotemporal Bayesian inference dipole analysis for MEG neuroimaging data.Neuroimage. 2005 Oct 15;28(1):84-98. doi: 10.1016/j.neuroimage.2005.06.003. Epub 2005 Jul 15. Neuroimage. 2005. PMID: 16023866
-
Spatially sparse source cluster modeling by compressive neuromagnetic tomography.Neuroimage. 2010 Oct 15;53(1):146-60. doi: 10.1016/j.neuroimage.2010.05.013. Epub 2010 May 19. Neuroimage. 2010. PMID: 20488248 Free PMC article.
-
Beamformer analysis of MEG data.Int Rev Neurobiol. 2005;68:149-71. doi: 10.1016/S0074-7742(05)68006-3. Int Rev Neurobiol. 2005. PMID: 16443013 Review. No abstract available.
-
Amplitude asymmetry: a direct link between ongoing oscillatory activity and event-related potentials?J Neurosci. 2008 Dec 3;28(49):13025-7. doi: 10.1523/JNEUROSCI.4670-08.2008. J Neurosci. 2008. PMID: 19052193 Free PMC article. Review. No abstract available.
Cited by
-
Automatic relevance determination based hierarchical Bayesian MEG inversion in practice.Neuroimage. 2007 Sep 1;37(3):876-89. doi: 10.1016/j.neuroimage.2007.04.021. Epub 2007 Apr 19. Neuroimage. 2007. PMID: 17627847 Free PMC article.
-
Dynamic causal modeling for EEG and MEG.Hum Brain Mapp. 2009 Jun;30(6):1866-76. doi: 10.1002/hbm.20775. Hum Brain Mapp. 2009. PMID: 19360734 Free PMC article. Review.
-
A Novel Bayesian Approach for EEG Source Localization.Comput Intell Neurosci. 2020 Oct 30;2020:8837954. doi: 10.1155/2020/8837954. eCollection 2020. Comput Intell Neurosci. 2020. PMID: 33178259 Free PMC article.
-
Imaging brain source extent from EEG/MEG by means of an iteratively reweighted edge sparsity minimization (IRES) strategy.Neuroimage. 2016 Nov 15;142:27-42. doi: 10.1016/j.neuroimage.2016.05.064. Epub 2016 May 27. Neuroimage. 2016. PMID: 27241482 Free PMC article.
-
Voxel-based dipole orientation constraints for distributed current estimation.IEEE Trans Biomed Eng. 2014 Jul;61(7):2028-40. doi: 10.1109/TBME.2014.2312713. IEEE Trans Biomed Eng. 2014. PMID: 24951674 Free PMC article.
References
-
- Auranen T,Nummenmaa A,Hämäläinen MS,Jääskeläinen IP,Lampinen J,Vehtari A,Sams M ( 2005): Bayesian analysis of the neuromagnetic inverse problem with ℓp‐norm priors. Neuroimage 26: 870–884. - PubMed
-
- Baillet S,Garnero L ( 1997): A Bayesian approach to introducing anatomo‐functional priors in the EEG/MEG inverse problem. IEEE Trans Biomed Eng 44: 374–385. - PubMed
-
- Baillet S,Mosher JC,Leahy RM ( 2001): Electromagnetic brain mapping. IEEE Signal Process Mag 18: 14–30.
-
- Bernardo JM,Smith AFM ( 1994): Bayesian Theory. Chichester: Wiley.
-
- Bertrand C,Ohmi M,Suzuki R,Kado H ( 2001): A probabilistic solution to the MEG inverse problem via MCMC methods: The reversible jump and parallel tempering algorithms. IEEE Trans Biomed Eng 48: 533–542. - PubMed
Publication types
MeSH terms
LinkOut - more resources
Full Text Sources
Miscellaneous

