. 2007 Apr 16;204(4):735-45.
doi: 10.1084/jem.20061405. Epub 2007 Mar 19.

CCR7 is required for the in vivo function of CD4+ CD25+ regulatory T cells

Affiliations

CCR7 is required for the in vivo function of CD4+ CD25+ regulatory T cells

Martin A Schneider et al. J Exp Med. .

Abstract

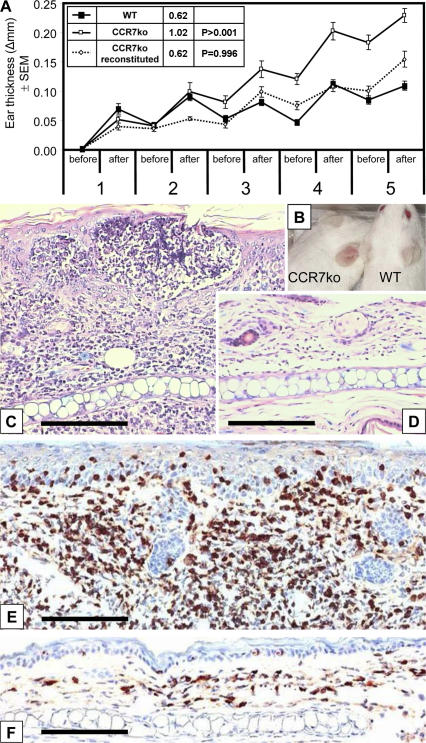
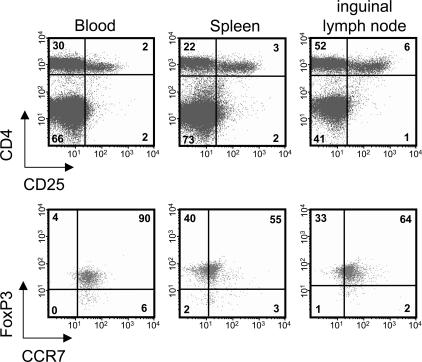
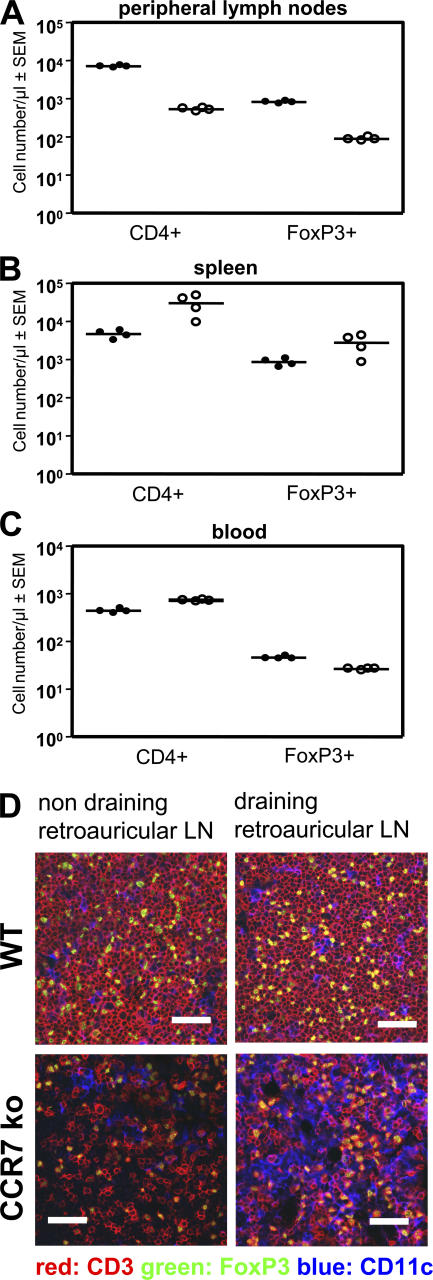
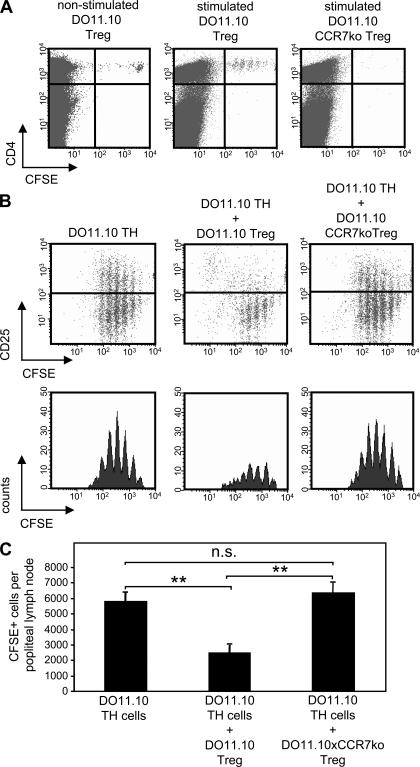
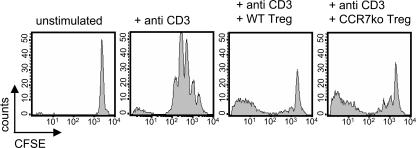
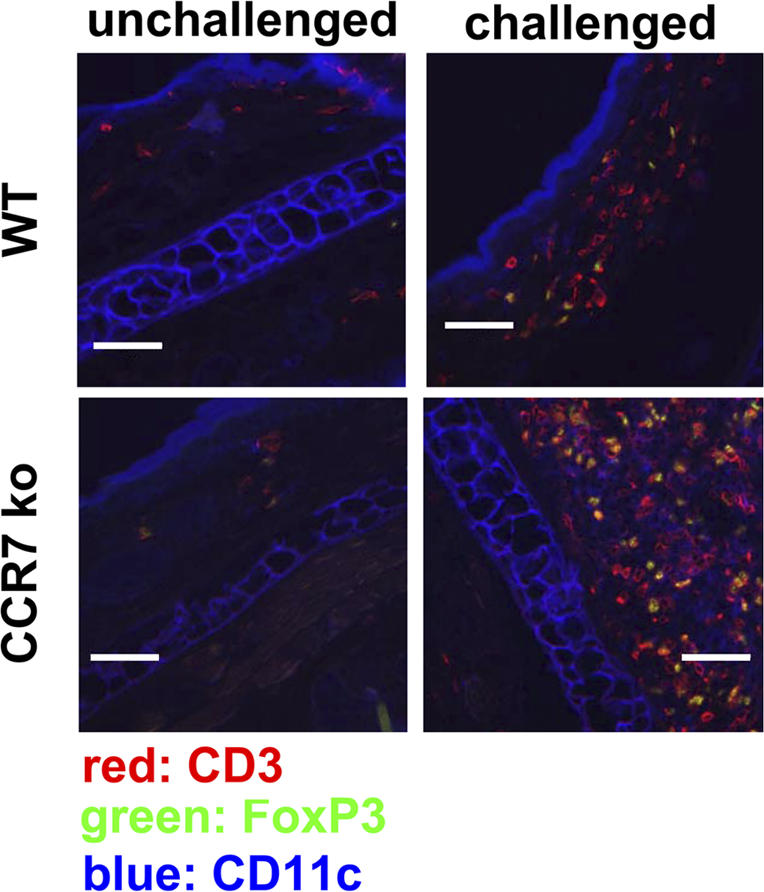
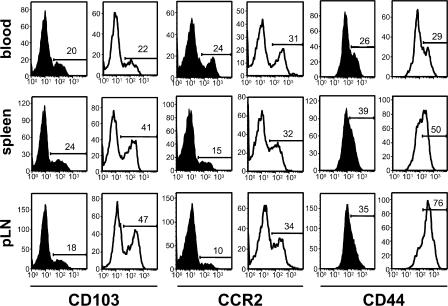
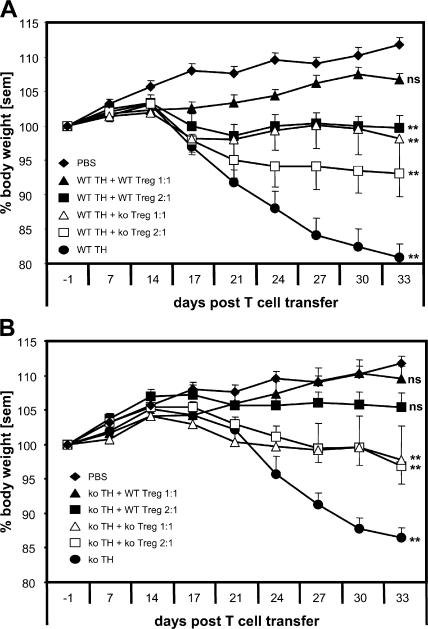
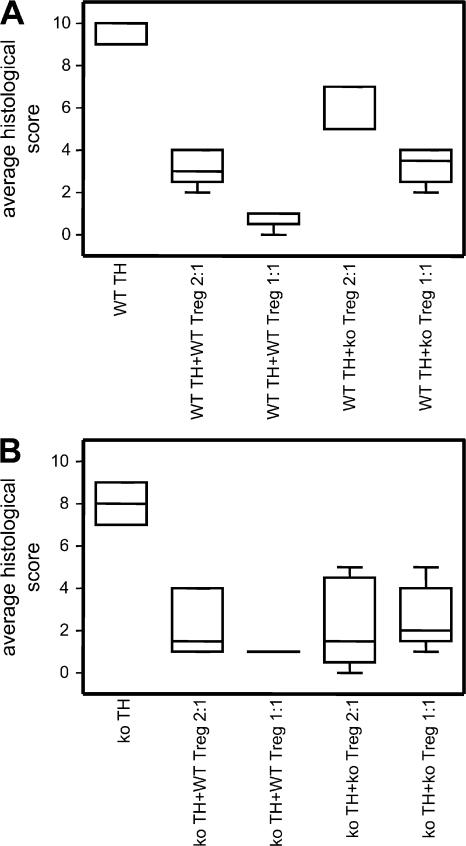
CCR7-mediated migration of naive T cells into the secondary lymphoid organs is a prerequisite for their encounter with mature dendritic cells, the productive presentation of cognate antigen, and consequent T cell proliferation and effector differentiation. Therefore, CCR7 was suggested to play an important role in the initiation of adaptive immune responses. In this study, we show that primary immunity can also develop in the absence of CCR7. Moreover, CCR7-deficient knockout (KO) mice display augmented immune responses. Our data cumulatively suggest that enhanced immunity in CCR7 KO mice is caused by the defective lymph node (LN) positioning of FoxP3(+) CD4(+) CD25(+) regulatory T cells (T reg cells) and the consequent impediment of their function. The FoxP3(+) T reg cells express CCR7 and, after their adoptive transfer, migrate into the LNs of wild-type mice. Here, they proliferate in situ upon antigen stimulation and inhibit the generation of antigen-specific T cells. Conversely, transferred CCR7-deficient T reg cells fail to migrate into the LNs and suppress antigen-induced T cell responses. The transfer of combinations of naive and T reg cells from wild-type and CCR7 KO mice into syngeneic severe combined immunodeficient mice directly demonstrates that CCR7-deficient T reg cells are less effective than their wild-type counterparts in preventing the development of inflammatory bowel disease.


Figures

Figure 1.
Figure 1.
CCR7 KO mice show enhanced CHS reaction to oxazolone. (A) The ear thickness before and after five repeated oxazolone challenges in sensitized mice; data are expressed as mean differences between the hapten- and vehicle-challenged ears. From the third challenge onwards, CCR7 KO mice (white symbols; n = 19) have an enhanced ear swelling compared with WT mice (black symbols; n = 10). The augmented ear swelling in CCR7 KO was reversed by the transfer of 5 × 10⁵ naive WT T reg cells (dotted line; n = 7). Inset table shows the area under the curve values and their statistical analysis (Student's t test). Error bars represent SEM. (B) After the last challenge, the difference between WT and CCR7 KO mice can be observed as an enhanced flare. (C and D) Microscopically, the CHS lesions contain a massive mononuclear infiltrate in CCR7 KO mice (C) in comparison with a moderate infiltrate in WT mice (D). (E and F) CD3 immunostaining of the CHS lesions in CCR7 KO (F) and WT mice (E) revealed that the infiltrate consists mostly of CD3+ cells. Bars, 50 μm.
Figure 2.
Figure 2.
CCR7 is expressed by FoxP3+ CD4+ CD25+ T reg cells. Flow cytometric analysis of peripheral blood and single-cell suspensions of spleen and inguinal LNs of WT mice revealed that CD4+ CD25+ T reg cells coexpress FoxP3 and CCR7. Dot plots of FoxP3 and CCR7 staining (bottom) are gated on the CD4+ CD25+ T cells shown in the top panel. Numbers indicate the percentage of cells in each quadrant.
Figure 3.
Figure 3.
Numbers of CD4+ and FoxP3+ cells in the peripheral LN, blood, and spleen of WT and CCR7 KO mice. (A) Few CD4+ and FoxP3+ cells can be found in the peripheral LNs of CCR7 KO mice (white circles) compared with WT mice (black circles). (B and C) In contrast, both populations are increased in the spleen (B), whereas in blood, only the CD4+ cells are increased, and FoxP3+ cells are reduced (n = 4; C). Horizontal lines represent the mean values. (D) CD3+ and FoxP3+ T cells show altered distribution in retroauricular LNs of CCR7 KO mice compared with normal architecture in WT mice. Organized T cell zones of WT LNs are shown. This microarchitecture cannot be found in CCR7 KO mice, where diffuse T cell distribution is observed. Bars, 200 μm.
Figure 4.
Figure 4.
Adoptively transferred CCR7 KO T reg cells cannot suppress the antigen-induced expansion of TCR transgenic T cells. (A) 5 × 10⁵ transferred CFSE-labeled T reg cells from DO11.10 mice enter LNs and, after antigen stimulation, expand in draining popliteal LNs and not in counterlateral LNs. Only a few T reg cells from DO11.10 × CCR7 KO can be detected in the LNs after their transfer. (B) Antigen-induced expansion of 5 × 10⁵ CFSE-labeled DO11.10 CD4+ Th cells; their concurrent CD25 up-regulation is suppressed by the cotransfer of DO11.10 T reg cells but not DO11.10 × CCR7 KO T reg cells. Th cells regulated by WT T reg cells divide approximately one generation less in comparison with two other groups (dot plots). In unregulated and CCR7 KO T reg cell–regulated groups, the majority of Th cells are in generations three, four, and five, whereas the majority of Th cells regulated by WT T reg cells are in generations two, three, and four; their overall numbers are also reduced (histograms). (C) Statistical evaluation of the data in B (n = 4). The cotransfer of T reg cells from DO11.10 mice reduced (**, P < 0.01) the mean total number of CFSE+ T cells in the draining popliteal LNs, whereas the cotransferred DO11.10 × CCR7 KO T reg cells showed no effect. Error bars represent SEM.
Figure 5.
Figure 5.
In vitro function of CD4+ CD25+ T reg cells is not dependent on CCR7 expression. Polyclonal CD4+ T cells were stained with CFSE and stimulated with anti-CD3 mAb for 72 h in the presence of CD4+ CD25+ T reg cells from either WT or CCR7 KO mice. Both T reg cell populations show similar in vitro suppression of T cell proliferation in a dose-dependent manner (a 1:1 ratio is shown).
Figure 6.
Figure 6.
FoxP3+ T reg cells enter the CHS lesions of CCR7 KO mice. Immunofluorescence in the unchallenged (left) ears and oxazolon-challenged (right) ears of WT and CCR7 KO mice. The challenged ears of CCR7 KO mice contain an elevated number of CD3+ FoxP3+ T reg cells in comparison with WT mice. One representative ear sample out of 10 mice per group is shown. Bars, 200 μm.
Figure 7.
Figure 7.
FoxP3+ T reg cells in CCR7 KO mice have a higher expression of CD44 and an increased frequency of CD103+ and CCR2+ subpopulations. Histograms of data acquired from the blood, spleen, and peripheral LNs are shown. 104 FoxP3+ T cells are depicted per histogram. In comparison with CCR7 KO mice (white histograms), WT mice (black histograms) have comparatively smaller subpopulations of CD103+ and CCR2+ T reg cells. CCR7 KO T reg cells also express higher levels of CD44. One out of four measurements on cells from different mice are shown. Numbers indicate the percentages of positive cells.
Figure 8.
Figure 8.
Ineffective control of experimental IBD by CD4+ CD25+ CCR7 KO T reg cells. (A and B) The transfer of WT (A) or CCR7 KO (B) CD4 Th cells (black circles) into SCID mice induces weight loss, albeit with different kinetics. Disease induced by WT Th cells is prevented by the cotransfer of WT T reg cells in both ratios of 1:2 (black squares) and 1:1 (black triangles), whereas CCR7 KO T reg cells in ratios 1:2 (white squares) and 1:1 (white triangles) were less effective than their WT counterparts. The regulatory effect for both WT and CCR7 KO T reg cells was cell dose dependent (A). IBD induced by CCR7 KO Th cells developed with a 1-wk delay and was completely prevented by WT T reg cells and to a lesser extent by CCR7 KO T reg cells. In the latter case, no cell dose dependency could be observed (B). The last data points of the curves were analyzed with one-way analysis of variance and Dunnett's correction in comparison with untransferred control mice (**, P < 0.01). Error bars represent SEM.
Figure 9.
Figure 9.
Mean histological scores of IBD lesions. Histological scores were obtained by evaluating sections prepared from the descending colon of individual mice. Epithelial cell damage, architectural changes, neutrophil, and mononuclear cell infiltrates as well as ulceration and granuloma formation were evaluated and scored blind independently of each other. Data are presented as box plots (n = 6 per group). Additionally, micrographs are shown in Fig. S4 (available at http://www.jem.org/cgi/content/full/jem.20061405/DC1). Data were analyzed with analysis of variance and Bonferroni correction to compare different groups. Apart from WT Th cells + WT T reg cells (2:1) compared with WT Th cells + KO T reg cells (1:1), all groups are significantly different (P < 0.001; A). In B, only KO Th cells are significantly different from other groups (P < 0.001). Error bars represent SEM.

References

    1. Itano, A.A., and M.K. Jenkins. 2003. Antigen presentation to naive CD4 T cells in the lymph node. Nat. Immunol. 4:733–739. - PubMed
    1. von Andrian, U.H., and T.R. Mempel. 2003. Homing and cellular traffic in lymph nodes. Nat. Rev. Immunol. 3:867–878. - PubMed
    1. Sanchez-Sanchez, N., L. Riol-Blanco, and J.L. Rodriguez-Fernandez. 2006. The multiple personalities of the chemokine receptor CCR7 in dendritic cells. J. Immunol. 176:5153–5159. - PubMed
    1. Sallusto, F., D. Lenig, R. Forster, M. Lipp, and A. Lanzavecchia. 1999. Two subsets of memory T lymphocytes with distinct homing potentials and effector functions. Nature. 401:708–712. - PubMed
    1. Forster, R., A. Schubel, D. Breitfeld, E. Kremmer, I. Renner-Muller, E. Wolf, and M. Lipp. 1999. CCR7 coordinates the primary immune response by establishing functional microenvironments in secondary lymphoid organs. Cell. 99:23–33. - PubMed

Publication types

MeSH terms