. 2007 Apr 1;178(7):4194-213.
doi: 10.4049/jimmunol.178.7.4194.

Cytokine-mediated disruption of lymphocyte trafficking, hemopoiesis, and induction of lymphopenia, anemia, and thrombocytopenia in anti-CD137-treated mice

Affiliations

Cytokine-mediated disruption of lymphocyte trafficking, hemopoiesis, and induction of lymphopenia, anemia, and thrombocytopenia in anti-CD137-treated mice

Liguo Niu et al. J Immunol. .

Abstract

CD137-mediated signals costimulate T cells and protect them from activation-induced apoptosis; they induce curative antitumor immunity and enhance antiviral immune responses in mice. In contrast, anti-CD137 agonistic mAbs can suppress T-dependent humoral immunity and reverse the course of established autoimmune disease. These results have provided a rationale for assessing the therapeutic potential of CD137 ligands in human clinical trials. In this study, we report that a single 200-mug injection of anti-CD137 given to otherwise naive BALB/c or C57BL/6 mice led to the development of a series of immunological anomalies. These included splenomegaly, lymphadenopathy, hepatomegaly, multifocal hepatitis, anemia, altered trafficking of B cells and CD8 T cells, loss of NK cells, and a 10-fold increase in bone marrow (BM) cells bearing the phenotype of hemopoietic stem cells. These events were dependent on CD8 T cells, TNF-alpha, IFN-gamma, and type I IFNs. BM cells up-regulated Fas, and there was a significant increase in the number of CD8+ T cells that correlated with a loss of CD19+ and Ab-secreting cells in the BM. TCR Valphabeta usage was random and polyclonal among liver-infiltrating CD8 T cells, and multifocal CD8+ T cell infiltrates were resolved upon termination of anti-CD137 treatment. Anti-CD137-treated mice developed lymphopenia, thrombocytopenia, and anemia, and had lowered levels of hemoglobin and increased numbers of reticulocytes.


Conflict of interest statement

Disclosures:

The authors have no financial conflict of interest.

Figures
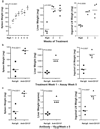
FIGURE 1
FIGURE 1
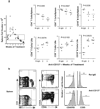
Pathology and transaminase levels. a, BL/6 female mice were injected i.p. weekly with 200 µg of anti-CD137 or rat IgG, as indicated. One week after the indicated number of injections, the mice were euthanized, and spleens, livers, and inguinal nodes (combined) were weighed. A single 3-wk time point is shown for rat IgG-injected mice. b, Organ weight 5 wk after a single 200-µg i.p. injection of rat IgG or anti-CD137 mAbs. The data shown are representative of one of three separate experiments. c, Organ weight 5 wk after five weekly 10-µg i.p. injections of rat IgG or anti-CD137 mAbs. d, Spleens, livers, and lungs were obtained from mice 1 wk following the fifth weekly i.p. injection of 200 µg of rat IgG or anti-CD137. Tissues were fixed, paraffin embedded, cut into 5-µm sections, H&E stained, and photographed. e, Before euthanization, the mice were bled, and serum was collected and analyzed for levels of glutamic oxaloacetic transaminase and glutamic pyruvate transaminase. One of two experiments is shown, and symbols represent individual mice.
FIGURE 1
FIGURE 1
Pathology and transaminase levels. a, BL/6 female mice were injected i.p. weekly with 200 µg of anti-CD137 or rat IgG, as indicated. One week after the indicated number of injections, the mice were euthanized, and spleens, livers, and inguinal nodes (combined) were weighed. A single 3-wk time point is shown for rat IgG-injected mice. b, Organ weight 5 wk after a single 200-µg i.p. injection of rat IgG or anti-CD137 mAbs. The data shown are representative of one of three separate experiments. c, Organ weight 5 wk after five weekly 10-µg i.p. injections of rat IgG or anti-CD137 mAbs. d, Spleens, livers, and lungs were obtained from mice 1 wk following the fifth weekly i.p. injection of 200 µg of rat IgG or anti-CD137. Tissues were fixed, paraffin embedded, cut into 5-µm sections, H&E stained, and photographed. e, Before euthanization, the mice were bled, and serum was collected and analyzed for levels of glutamic oxaloacetic transaminase and glutamic pyruvate transaminase. One of two experiments is shown, and symbols represent individual mice.
FIGURE 2
FIGURE 2
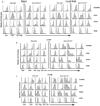
Spleen and LN cell numbers. a, Total spleen cell numbers (rectangle represents mice within spleen cells within the normal range) as well as T and B cell numbers from spleens and inguinal LNs obtained from anti-CD137- or rat IgG-injected mice for the indicated periods were determined following FACS analysis. CD137- or rat IgG-injected mice were collected 1 wk after the indicated number of injections. Cell numbers in lymphoid tissues of rat IgG-injected mice varied by <10% over the course of three weekly injections, and the time point shown in all figures is of mice that received three injections. b–e, Single-cell suspensions of spleen, LN, liver, and lung, respectively, from anti-CD137- or rat IgG-injected mice were phenotyped 1 wk following three weekly injections for T, NK, and NKT cells; CD44, CD62L, CD45RB, and CD69 expression was measured on T cells.
FIGURE 2
FIGURE 2
Spleen and LN cell numbers. a, Total spleen cell numbers (rectangle represents mice within spleen cells within the normal range) as well as T and B cell numbers from spleens and inguinal LNs obtained from anti-CD137- or rat IgG-injected mice for the indicated periods were determined following FACS analysis. CD137- or rat IgG-injected mice were collected 1 wk after the indicated number of injections. Cell numbers in lymphoid tissues of rat IgG-injected mice varied by <10% over the course of three weekly injections, and the time point shown in all figures is of mice that received three injections. b–e, Single-cell suspensions of spleen, LN, liver, and lung, respectively, from anti-CD137- or rat IgG-injected mice were phenotyped 1 wk following three weekly injections for T, NK, and NKT cells; CD44, CD62L, CD45RB, and CD69 expression was measured on T cells.
FIGURE 3
FIGURE 3
Phenotypic analysis of T cell subsets. CD3+CD4+, CD3+CD8+, CD3+CD4+CD8+, and CD3+CD4CD8 T cell subsets from the spleen (a), LNs (a), livers (b), and lungs (c) of anti-CD137- or rat IgG-injected mice (weekly × 3) were phenotyped 1 wk following the final injection of Ab. The data are representative of one of five mice/group, and the experiment was repeated twice.
FIGURE 4
FIGURE 4
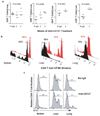
B cells, BM, and ASC. BM cells were obtained from the femurs of rat IgG- and anti-CD137-treated mice that had received weekly injections of 200 µg of Ab over a 5-wk period. The mice were euthanized 1 wk later, and single-cell suspensions were prepared by passage through 70-mesh nylon screens, counted for cell viability, stained with the indicated fluorochrome-conjugated mAbs, and analyzed by flow cytometry. The absolute number of a, CD19+ cells; b, CD8+ cells; c, c-kit+ Sca-1+ Lin hemopoietic stem cells (KSL); and d, Fas+ cells was determined by FACS analysis. e, The number of CD19+ BM cells/femur was determined in C57BL/6 IFN-γ-deficient mice injected with either rat IgG or anti-CD137, as described above.f, The number of IgG-secreting BM cells/femur of Ab-treated mice was determined by ELISPOT assay.
FIGURE 5
FIGURE 5
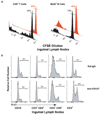
a, In vivo proliferation of LN CD8 T cells and B220 B cells was conducted by adoptively transferring CFSE-labeled BL/6 CD45.1 congenic spleen cells into wild-type CD45.2 BL/6 mice before treating the mice with five weekly injections of 200 µg of anti-CD137 or rat IgG. FACS analysis was performed at week 6. CD45.1 CD3+CD8+ T cell and CD19+ B cell proliferation was determined by CFSE dilution. Black histograms represent CD137-treated mice, and red histograms represent rat IgG-treated mice. The percentages shown for each histogram represent the frequency of nondividing cells in each gated population denoted by the horizontal bar intersecting the histogram peak. b, Inguinal LN B and T cell proliferation was also determined by BrdU short pulse labeling for 4 h following the third weekly injection of anti-CD137 or rat IgG.
FIGURE 6
FIGURE 6
Liver- and lung-infiltrating T cells, and CD8 T cell proliferation. a, Absolute numbers of lung and liver CD4 and CD8 T cells from rat IgG- and anti-CD137 mAb-treated mice were determined by FACS analysis 1 wk after the fifth weekly injection of Ab. b, CD8 T cell proliferation was determined by gating on CFSE-labeled CD45.1 BL/6 CD8 T cells in the spleen, liver, and lungs of anti-CD137 (black histograms)- or rat IgG (red histograms)-injected mice. Percentages represent the frequency of cells in the gated regions indicated by horizontal bars intersecting the peaks. c, Proliferation was also determined by BrdU short pulse labeling for 4 h following the final weekly injection of anti-CD137 or rat IgG.
FIGURE 7
FIGURE 7
Lymphocyte proliferation. Lymphocyte proliferation in the spleen (a), LN (b), liver (c), and lung (d) was assessed following a 4-h pulse with BrdU (2 mg in 0.2 ml of PBS) injected i.p. 24 h following the third weekly injection of 200 µg of either rat IgG or anti-CD137 mAb. All animals were euthanized, and single-cell suspensions were prepared and surface stained with the indicated fluorochrome-conjugated mAbs. The cells were then permeabilized and stained with FITC anti-BrdU following the manufacturer’s protocol (BD Immunocytometry Systems) and analyzed by multicolor flow cytometry using a LSR II multiparameter flow cytometer (BD Immunocytometry Systems). No differences were observed between controls and treated groups in the thymus and BM (data not shown).
FIGURE 7
FIGURE 7
Lymphocyte proliferation. Lymphocyte proliferation in the spleen (a), LN (b), liver (c), and lung (d) was assessed following a 4-h pulse with BrdU (2 mg in 0.2 ml of PBS) injected i.p. 24 h following the third weekly injection of 200 µg of either rat IgG or anti-CD137 mAb. All animals were euthanized, and single-cell suspensions were prepared and surface stained with the indicated fluorochrome-conjugated mAbs. The cells were then permeabilized and stained with FITC anti-BrdU following the manufacturer’s protocol (BD Immunocytometry Systems) and analyzed by multicolor flow cytometry using a LSR II multiparameter flow cytometer (BD Immunocytometry Systems). No differences were observed between controls and treated groups in the thymus and BM (data not shown).
FIGURE 8
FIGURE 8
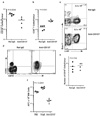
TCR Vαβ usage by liver-infiltrating CD8 T cells and liver NK/NKT cells. a and b, TCR Vα and Vβ usage, respectively, by liver-infiltrating CD8 was determined in three separate experiments by staining CD8 T cells with fluorochrome-conjugated mAbs specific for individual Vαβ gene products, followed by FACS analysis 1 wk following the last of three weekly 200-µg injections of anti-CD137 or rat IgG. c, The absolute number of liver-infiltrating NK and NKT T cells was determined by flow cytometry following staining with anti-CD3 and NK1.1.
FIGURE 9
FIGURE 9
Peripheral mononuclear cells and blood elements. CBC were determined in anti-CD137 (▲)- and rat IgG (■)-treated mice (n = 5) and analyzed. a, White blood cells/µl whole blood. b, Total number of lymphocytes/µl whole blood. c, Total number of monocytes/µl whole blood. d, Total number of platelets × 10−3/µl whole blood. e, Total number of reticulocytes × 10−5/µl whole blood.f, Hemoglobin concentration.
FIGURE 10
FIGURE 10
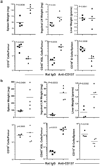
Anti-CD137 treatment of CD8- or CD4-deficient mice. a and b, Spleens, inguinal LNs, and livers from C57BL/6 CD8-or CD4-deficient mice, respectively, were collected 1 wk following the fifth weekly injection of anti-CD137 or rat IgG mAb and weighed. BM from the femurs was prepared and pheno-typed by FACS, and the number of BM CD19+ and KSL (c-kit+ Sca-1+ Lin) cells was determined.
FIGURE 11
FIGURE 11
Anti-CD137 treatment of TNF-α-deficient mice. BL/6 TNF-α−/− mice were injected i.p. with 200 µg of rat IgG or anti-CD137 mAbs 1 × weekly for 3 wk. The following week, the mice were bled and euthanized. Spleen, inguinal LNs, and livers were weighed (a–c), and tissues were processed into single-cell suspensions, stained for CD8 T and CD19-positive B cells, and analyzed by FACS. From FACS frequency plots and microscopic count of viable cells, absolute numbers of liver and LN CD8 T cells were determined (d and e, respectively), and LN and splenic CD19 B cells were determined (f and g, respectively).
FIGURE 12
FIGURE 12
Anti-CD137 treatment of IFN-γ- and IFN-αR-deficient mice. a, Inguinal LNs from IFN-γ-deficient mice were collected 1 wk following the third weekly injection of anti-CD137 or rat IgG, weighed and processed into single-cell suspensions, and phenotyped by FACS to determine total B cell and CD8 T cell numbers. b, BM, inguinal LNs, and spleens were collected from IFN-αR-deficient mice, as above. CD19+ cell, KSL cell, and CD8+ T cell numbers were determined in single-cell suspensions stained with fluorochrome-conjugated anti-CD19, anti-CD3, anti-CD8, anti-c-kit, anti-Sca-1, and lineage-specific mAbs. B cells, KSL cells, and CD8 T cells were enumerated following FACS analysis.

Similar articles

Cited by

References

    1. Watts TH. TNF/TNFR family members in costimulation of T cell responses. Annu. Rev. Immunol. 2005;23:23–68. - PubMed
    1. Melero I, Shuford WW, Newby SA, Aruffo A, Ledbetter JA, Hellstrom KE, Mittler RS, Chen L. Monoclonal antibodies against the 4-1BB T-cell activation molecule eradicate established tumors. Nat. Med. 1997;3:682–685. - PubMed
    1. Melero I, Bach N, Hellstrom KE, Aruffo A, Mittler RS, Chen L. Amplification of tumor immunity by gene transfer of the co-stimulatory 4-1BB ligand: synergy with the CD28 costimulatory pathway. Eur. J. Immunol. 1998;28:1116–1121. - PubMed
    1. Wang J, Guo Z, Dong Y, Kim O, Hart J, Adams A, Larsen CP, Mittler RS, Newell KA. Role of 4-1BB in allograft rejection mediated by CD8+ T cells. Am. J. Transplant. 2003;3:543–551. - PubMed
    1. Foell J, Strahotin S, O’Neil SP, McCausland MM, Suwyn C, Haber M, Chander PN, Bapat AS, Yan XJ, Chiorazzi N, et al. CD137 costimulatory T cell receptor engagement reverses acute disease in lupus-prone NZB × NZW F1 mice. J. Clin. Invest. 2003;111:1505–1518. - PMC - PubMed

Publication types

MeSH terms

Substances