

Loss of the Par-1b/MARK2 polarity kinase leads to increased metabolic rate, decreased adiposity, and insulin hypersensitivity in vivo
- PMID: 17372192
- PMCID: PMC1838456
- DOI: 10.1073/pnas.0701179104
Loss of the Par-1b/MARK2 polarity kinase leads to increased metabolic rate, decreased adiposity, and insulin hypersensitivity in vivo
Abstract
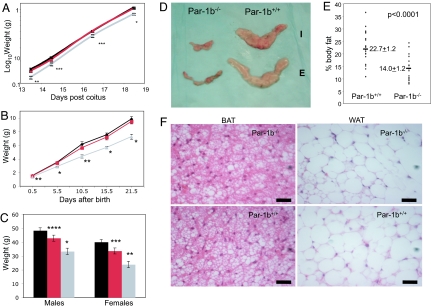
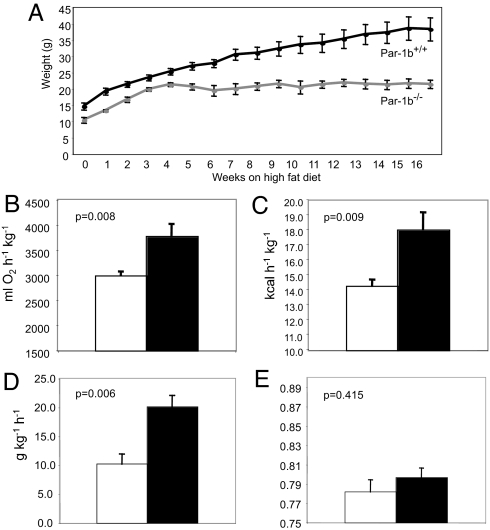
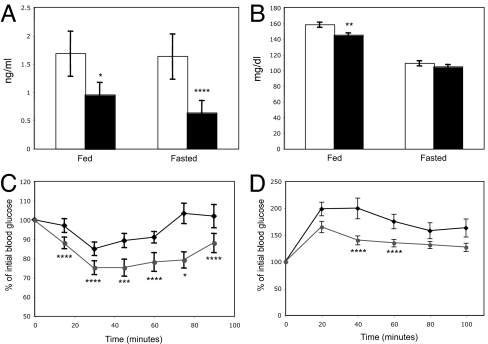
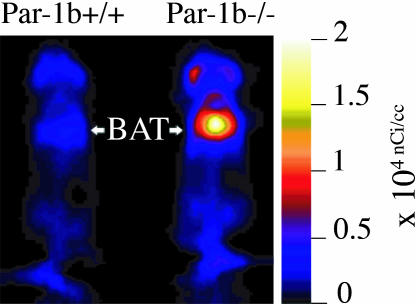
Obesity is a major factor central to the development of insulin resistance and type 2 diabetes. The identification and characterization of genes involved in regulation of adiposity, insulin sensitivity, and glucose uptake are key to the design and development of new drug therapies for this disease. In this study, we show that the polarity kinase Par-1b/MARK2 is required for regulating glucose metabolism in vivo. Mice null for Par-1b were lean, insulin hypersensitive, resistant to high-fat diet-induced weight gain, and hypermetabolic. (18)F-FDG microPET and hyperinsulinemic-euglycemic clamp analyses demonstrated increased glucose uptake into white and brown adipose tissue, but not into skeletal muscle of Par-1b null mice relative to wild-type controls. Taken together, these data indicate that Par-1b is a regulator of glucose metabolism and adiposity in the whole animal and may be a valuable drug target for the treatment of both type 2 diabetes and obesity.
Conflict of interest statement
The authors declare no conflict of interest.
Figures
Similar articles
-
Loss of Par-1a/MARK3/C-TAK1 kinase leads to reduced adiposity, resistance to hepatic steatosis, and defective gluconeogenesis.Mol Cell Biol. 2010 Nov;30(21):5043-56. doi: 10.1128/MCB.01472-09. Epub 2010 Aug 23. Mol Cell Biol. 2010. PMID: 20733003 Free PMC article.
-
Increased energy expenditure, decreased adiposity, and tissue-specific insulin sensitivity in protein-tyrosine phosphatase 1B-deficient mice.Mol Cell Biol. 2000 Aug;20(15):5479-89. doi: 10.1128/MCB.20.15.5479-5489.2000. Mol Cell Biol. 2000. PMID: 10891488 Free PMC article.
-
Inactivation of PKCtheta leads to increased susceptibility to obesity and dietary insulin resistance in mice.Am J Physiol Endocrinol Metab. 2007 Jan;292(1):E84-91. doi: 10.1152/ajpendo.00178.2006. Epub 2006 Aug 8. Am J Physiol Endocrinol Metab. 2007. PMID: 16896164
-
The imprinted gene Delta like non-canonical notch ligand 1 (Dlk1) associates with obesity and triggers insulin resistance through inhibition of skeletal muscle glucose uptake.EBioMedicine. 2019 Aug;46:368-380. doi: 10.1016/j.ebiom.2019.07.070. Epub 2019 Aug 3. EBioMedicine. 2019. PMID: 31383551 Free PMC article.
-
Metabolism and insulin signaling in common metabolic disorders and inherited insulin resistance.Dan Med J. 2014 Jul;61(7):B4890. Dan Med J. 2014. PMID: 25123125 Review.
Cited by
-
Sucrose nonfermenting AMPK-related kinase (SNARK) regulates exercise-stimulated and ischemia-stimulated glucose transport in the heart.J Cell Biochem. 2019 Jan;120(1):685-696. doi: 10.1002/jcb.27425. Epub 2018 Sep 7. J Cell Biochem. 2019. PMID: 30256437 Free PMC article.
-
LKB1 is a central regulator of tumor initiation and pro-growth metabolism in ErbB2-mediated breast cancer.Cancer Metab. 2013 Aug 14;1(1):18. doi: 10.1186/2049-3002-1-18. Cancer Metab. 2013. PMID: 24280377 Free PMC article.
-
MARK3-mediated phosphorylation of ARHGEF2 couples microtubules to the actin cytoskeleton to establish cell polarity.Sci Signal. 2017 Oct 31;10(503):eaan3286. doi: 10.1126/scisignal.aan3286. Sci Signal. 2017. PMID: 29089450 Free PMC article.
-
Protein Scaffolds Control Localized Protein Kinase Cζ Activity.J Biol Chem. 2016 Jun 24;291(26):13809-22. doi: 10.1074/jbc.M116.729483. Epub 2016 May 3. J Biol Chem. 2016. PMID: 27143478 Free PMC article.
-
Partitioning-Defective 1a/b Depletion Impairs Glomerular and Proximal Tubule Development.J Am Soc Nephrol. 2016 Dec;27(12):3725-3737. doi: 10.1681/ASN.2014111124. Epub 2016 May 16. J Am Soc Nephrol. 2016. PMID: 27185860 Free PMC article.
References
Publication types
MeSH terms
Substances
Grants and funding
LinkOut - more resources
Full Text Sources
Other Literature Sources
Medical
Molecular Biology Databases
