

Mouse embryo culture induces changes in postnatal phenotype including raised systolic blood pressure
- PMID: 17372207
- PMCID: PMC1838459
- DOI: 10.1073/pnas.0610317104
Mouse embryo culture induces changes in postnatal phenotype including raised systolic blood pressure
Abstract
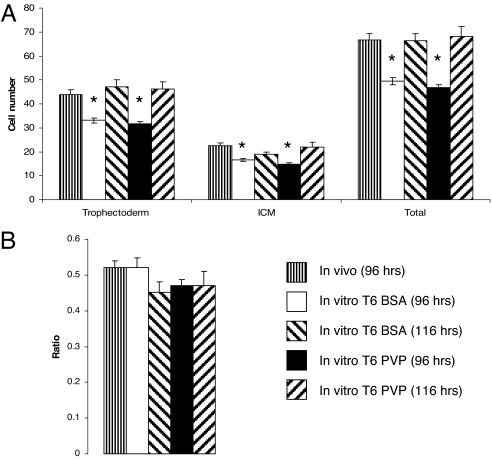
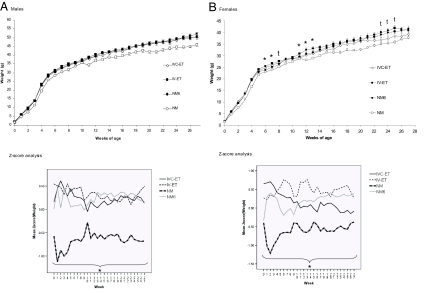
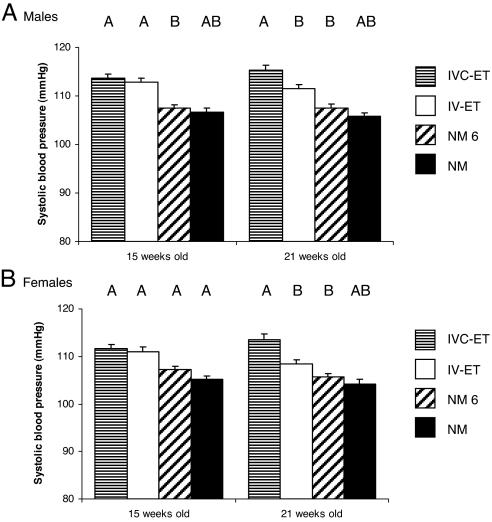
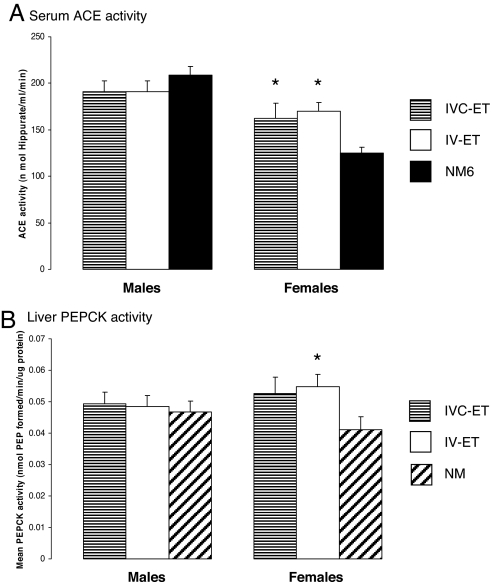
A key factor in the use of assisted reproductive technologies (ART) for diverse species is the safety of procedures for long-term health. By using a mouse model, we have investigated the effect of in vitro culture and embryo transfer (ET) of superovulated embryos on postnatal growth and physiological activity compared with that of embryos developing in vivo. Embryo culture from two-cell to blastocyst stages in T6 medium either with or without a protein source reduced blastocyst trophectoderm and inner cell mass cell number compared with that of embryos developing in vivo. Embryo culture and ET had minimal effects on postnatal growth when compared with in vivo development with an equivalent litter size. However, embryo culture, and to a lesser extent ET, led to an enhanced systolic blood pressure at 21 weeks compared with in vivo development independent of litter size, maternal origin, or body weight. Moreover, activity of enzymatic regulators of cardiovascular and metabolic physiology, namely, serum angiotensin-converting enzyme and the gluconeogenesis controller, hepatic phosphoenolpyruvate carboxykinase, were significantly elevated in response to embryo culture and/or ET in female offspring at 27 weeks, independent of maternal factors and postnatal growth. These animal data indicate that postnatal physiological criteria important in cardiovascular and metabolic health may be more sensitive to routine ART procedures than growth.
Conflict of interest statement
The authors declare no conflict of interest.
Figures
Similar articles
-
Insulin and branched-chain amino acid depletion during mouse preimplantation embryo culture programmes body weight gain and raised blood pressure during early postnatal life.Biochim Biophys Acta Mol Basis Dis. 2018 Feb;1864(2):590-600. doi: 10.1016/j.bbadis.2017.11.020. Epub 2017 Nov 28. Biochim Biophys Acta Mol Basis Dis. 2018. PMID: 29196239 Free PMC article.
-
The duration of embryo culture after mouse IVF differentially affects cardiovascular and metabolic health in male offspring.Hum Reprod. 2020 Nov 1;35(11):2497-2514. doi: 10.1093/humrep/deaa205. Hum Reprod. 2020. PMID: 33020802 Free PMC article.
-
Advanced maternal age causes adverse programming of mouse blastocysts leading to altered growth and impaired cardiometabolic health in post-natal life.Hum Reprod. 2016 Sep;31(9):1970-80. doi: 10.1093/humrep/dew177. Epub 2016 Jul 7. Hum Reprod. 2016. PMID: 27402911 Free PMC article.
-
Cellular mechanisms of monozygotic twinning: clues from assisted reproduction.Hum Reprod Update. 2024 Dec 1;30(6):692-705. doi: 10.1093/humupd/dmae022. Hum Reprod Update. 2024. PMID: 38996087 Free PMC article. Review.
-
In Vitro Culture of Mammalian Embryos: Is There Room for Improvement?Cells. 2024 Jun 7;13(12):996. doi: 10.3390/cells13120996. Cells. 2024. PMID: 38920627 Free PMC article. Review.
Cited by
-
Effects of the use of assisted reproduction and high-caloric diet consumption on body weight and cardiovascular health of juvenile mouse offspring.Reproduction. 2013 Nov 20;147(1):111-23. doi: 10.1530/REP-13-0354. Print 2014 Jan. Reproduction. 2013. PMID: 24163396 Free PMC article.
-
Mice generated by in vitro fertilization exhibit vascular dysfunction and shortened life span.J Clin Invest. 2013 Dec;123(12):5052-60. doi: 10.1172/JCI68943. Epub 2013 Nov 25. J Clin Invest. 2013. PMID: 24270419 Free PMC article.
-
Metabolic Syndrome and Its Components in Young Adults Conceived by ICSI.Int J Endocrinol. 2018 May 3;2018:8170518. doi: 10.1155/2018/8170518. eCollection 2018. Int J Endocrinol. 2018. PMID: 29853885 Free PMC article.
-
Abnormal Placentation Associated with Infertility as a Marker of Overall Health.Semin Reprod Med. 2017 May;35(3):205-216. doi: 10.1055/s-0037-1603570. Epub 2017 Jun 28. Semin Reprod Med. 2017. PMID: 28658703 Free PMC article. Review.
-
Insulin and branched-chain amino acid depletion during mouse preimplantation embryo culture programmes body weight gain and raised blood pressure during early postnatal life.Biochim Biophys Acta Mol Basis Dis. 2018 Feb;1864(2):590-600. doi: 10.1016/j.bbadis.2017.11.020. Epub 2017 Nov 28. Biochim Biophys Acta Mol Basis Dis. 2018. PMID: 29196239 Free PMC article.
References
-
- Fleming TP, Kwong WY, Porter R, Ursell E, Fesenko I, Wilkins A, Miller DJ, Watkins AJ, Eckert JJ. Biol Reprod. 2004;71:1046–1054. - PubMed
-
- Harlow GM, Quinn P. Aust J Biol Sci. 1982;35:187–193. - PubMed
-
- Rinaudo P, Schultz RM. Reproduction. 2004;128:301–311. - PubMed
-
- Khosla S, Dean W, Brown D, Reik W, Feil R. Biol Reprod. 2001;64:918–926. - PubMed
-
- Lane M, Gardner DK. J Reprod Fertil. 1997;109:153–164. - PubMed
Publication types
MeSH terms
Substances
Grants and funding
LinkOut - more resources
Full Text Sources
Other Literature Sources
