

Insulin growth factor-binding protein 2 is a candidate biomarker for PTEN status and PI3K/Akt pathway activation in glioblastoma and prostate cancer
- PMID: 17372210
- PMCID: PMC1838515
- DOI: 10.1073/pnas.0609139104
Insulin growth factor-binding protein 2 is a candidate biomarker for PTEN status and PI3K/Akt pathway activation in glioblastoma and prostate cancer
Abstract
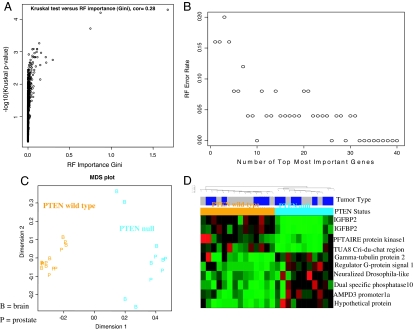
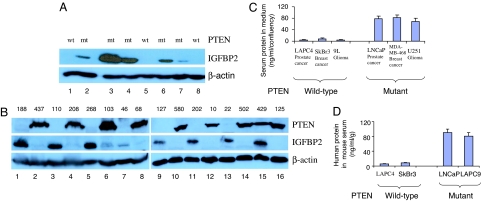
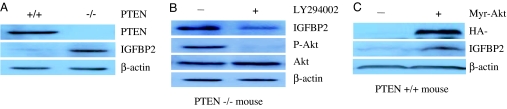
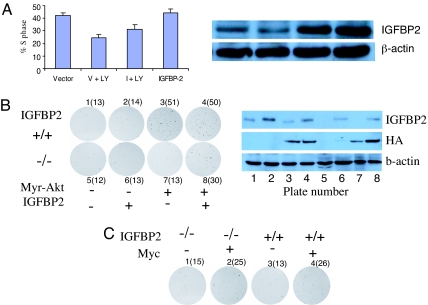
PTEN is an important tumor-suppressor gene associated with many cancers. Through expression profiling of glioblastoma tissue samples and prostate cancer xenografts, we identified a molecular signature for loss of the PTEN tumor suppressor in glioblastoma and prostate tumors. The PTEN signature consists of a minimum of nine genes, several of which are involved in various pathways already implicated in tumor formation. Among these signature genes, the most significant was an increase in insulin growth factor-binding protein 2 (IGFBP-2) mRNA. Up-regulation of IGFBP-2 was confirmed at the protein level by Western blot analysis and validated in samples not included in the microarray analysis. The link between IGFBP-2 and PTEN was of particular interest because elevated serum IGFBP-2 levels have been reported in patients with prostate and brain tumors. To further investigate this link, we determined that IGFBP-2 expression is negatively regulated by PTEN and positively regulated by phosphatidylinositol 3-kinase (PI3K) and Akt activation. In addition, Akt-driven transformation is impaired in IGFBP2(-/-) mouse embryo fibroblasts, implicating a functional role for IGFBP-2 in PTEN signaling. Collectively, these studies establish that PTEN and IGFBP-2 expression are inversely correlated in human brain and prostate cancers and implicate serum IGFBP-2 levels as a potential serum biomarker of PTEN status and PI3K Akt pathway activation in cancer patients.
Conflict of interest statement
The authors declare no conflict of interest.
Figures
Similar articles
-
Phosphatidylinositol 3-kinase (PI3K) signalling regulates insulin-like-growth factor binding protein-2 (IGFBP-2) production in human adipocytes.Growth Horm IGF Res. 2015 Jun;25(3):115-20. doi: 10.1016/j.ghir.2015.03.003. Epub 2015 Apr 11. Growth Horm IGF Res. 2015. PMID: 25900365
-
Impact of PTEN on the expression of insulin-like growth factors (IGFs) and IGF-binding proteins in human gastric adenocarcinoma cells.Biochem Biophys Res Commun. 2005 May 13;330(3):760-7. doi: 10.1016/j.bbrc.2005.03.045. Biochem Biophys Res Commun. 2005. PMID: 15809062
-
Insulin-like growth factor-binding protein-2 is required for osteoclast differentiation.J Bone Miner Res. 2012 Feb;27(2):390-400. doi: 10.1002/jbmr.545. J Bone Miner Res. 2012. PMID: 22006816 Free PMC article.
-
Interplay Among PI3K/AKT, PTEN/FOXO and AR Signaling in Prostate Cancer.Adv Exp Med Biol. 2019;1210:319-331. doi: 10.1007/978-3-030-32656-2_14. Adv Exp Med Biol. 2019. PMID: 31900915 Review.
-
Progress in targeting PTEN/PI3K/Akt axis in glioblastoma therapy: Revisiting molecular interactions.Biomed Pharmacother. 2023 Feb;158:114204. doi: 10.1016/j.biopha.2022.114204. Epub 2023 Jan 4. Biomed Pharmacother. 2023. PMID: 36916430 Review.
Cited by
-
IGFBP2 potentiates nuclear EGFR-STAT3 signaling.Oncogene. 2016 Feb 11;35(6):738-47. doi: 10.1038/onc.2015.131. Epub 2015 Apr 20. Oncogene. 2016. PMID: 25893308 Free PMC article.
-
Osteoblast Secretome Modulated by Abiraterone Treatment Affects Castration Resistant Prostate Cancer Cell Proliferation.Biomedicines. 2022 Sep 1;10(9):2154. doi: 10.3390/biomedicines10092154. Biomedicines. 2022. PMID: 36140255 Free PMC article.
-
GADD45gamma: a new vitamin D-regulated gene that is antiproliferative in prostate cancer cells.Endocrinology. 2010 Oct;151(10):4654-64. doi: 10.1210/en.2010-0434. Epub 2010 Aug 25. Endocrinology. 2010. PMID: 20739400 Free PMC article.
-
IGFBP2/FAK pathway is causally associated with dasatinib resistance in non-small cell lung cancer cells.Mol Cancer Ther. 2013 Dec;12(12):2864-73. doi: 10.1158/1535-7163.MCT-13-0233. Epub 2013 Oct 15. Mol Cancer Ther. 2013. PMID: 24130049 Free PMC article.
-
Can systems biology understand pathway activation? Gene expression signatures as surrogate markers for understanding the complexity of pathway activation.Curr Genomics. 2008;9(5):349-60. doi: 10.2174/138920208785133235. Curr Genomics. 2008. PMID: 19517027 Free PMC article.
References
-
- Golub TR, Slonim DK, Tamayo P, Huard C, Gaasenbeek M, Mesirov JP, Coller H, Loh ML, Downing JR, Caligiuri MA, et al. Science. 1999;286:531–537. - PubMed
-
- Ramaswamy S, Golub TR. J Clin Oncol. 2002;20:1932–1941. - PubMed
-
- Shai R, Shi T, Kremen TJ, Horvath S, Liau LM, Cloughesy TF, Mischel PS, Nelson SF. Oncogene. 2003;22:4918–4923. - PubMed
-
- Varambally S, Dhanasekaran SM, Zhou M, Barrette TR, Kumar-Sinha C, Sanda MG, Ghosh D, Pienta KJ, Sewalt RG, Otte AP, et al. Nature. 2002;419:624–629. - PubMed
-
- Singh D, Febbo PG, Ross K, Jackson DG, Manola J, Ladd C, Tamayo P, Renshaw AA, D'Amico AV, Richie JP, et al. Cancer Cell. 2002;1:203–209. - PubMed
Publication types
MeSH terms
Substances
LinkOut - more resources
Full Text Sources
Other Literature Sources
Medical
Research Materials
Miscellaneous
