. 2007 Apr 11;129(14):4328-35.
doi: 10.1021/ja067760f. Epub 2007 Mar 21.

Hydrogen bond lifetimes and energetics for solute/solvent complexes studied with 2D-IR vibrational echo spectroscopy

Affiliations

Hydrogen bond lifetimes and energetics for solute/solvent complexes studied with 2D-IR vibrational echo spectroscopy

Junrong Zheng et al. J Am Chem Soc. .

Abstract

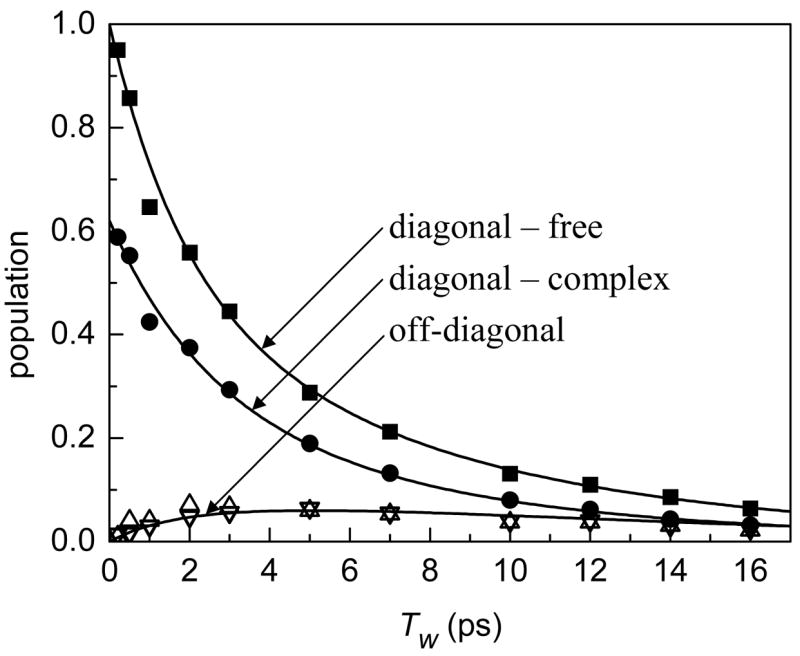
Weak pi hydrogen-bonded solute/solvent complexes are studied with ultrafast two-dimensional infrared (2D-IR) vibrational echo chemical exchange spectroscopy, temperature-dependent IR absorption spectroscopy, and density functional theory calculations. Eight solute/solvent complexes composed of a number of phenol derivatives and various benzene derivatives are investigated. The complexes are formed between the phenol derivative (solute) in a mixed solvent of the benzene derivative and CCl4. The time dependence of the 2D-IR vibrational echo spectra of the phenol hydroxyl stretch is used to directly determine the dissociation and formation rates of the hydrogen-bonded complexes. The dissociation rates of the weak hydrogen bonds are found to be strongly correlated with their formation enthalpies. The correlation can be described with an equation similar to the Arrhenius equation. The results are discussed in terms of transition state theory.


Figures

Figure 1
Figure 1
Two views of the hydrogen bonded structure of the phenol-toluene complex calculated with DFT at the B3LYP/6–31+ G (d,p) level for the isolated molecules. The complex’s binding energy is found to be −2.3 kcal/mol (with zero point energy correction) without solvent interactions.
Figure 2
Figure 2
FT-IR absorption spectra of the OD stretch of phenol-OD (hydroxyl H replaced with D) in CCl4 (free phenol, dotted curve), phenol in toluene (hydrogen-bonded phenol-toluene complex, dashed curve), and phenol in the mixed toluene/CCl4 solvent, which displays absorptions for both free and complexed phenol (solid curve).
Figure 3
Figure 3
Correlation between the frequency shift (relative to the free species) of (a) OD stretch and (b) OH stretch of complexes of phenol and its derivatives to benzene derivatives and the complex (hydrogen bond) dissociation enthalpies (negative values of formation enthalpies). The two plots show a linear relationship between the parameters.
Figure 4
Figure 4
2D-IR vibrational echo spectra of the OD stretch of phenol in the mixed toluene/CCl4 solvent (only 0–1 transition data are shown). The data have been normalized to the largest peak for each Tw. Each contour represents 10% change in amplitude. (a) Data for Tw = 200 fs. (b) Data for Tw = 12 ps. At the longer time, additional peaks have grown in because of chemical exchange, that is, the formation and dissociation of the hydrogen bonded complex of phenol and toluene.
Figure 5
Figure 5
The time dependence of the 2D-IR vibrational echo spectrum in the 0–1 transition region. The data have been normalized to the largest peak for each Tw. Each contour represents 10% change in amplitude. As Tw increases, the off-diagonal peaks grow in because of chemical exchange (formation and dissociation of the toluene-phenol complex). Inspection of the data shows that the time scale for the chemical exchange (growth of the off-diagonal peaks) is a few picoseconds.
Figure 6
Figure 6
Tw dependent data (symbols) showing the time dependence of the 2 diagonal and 2 off-diagonal peaks, in the 0–1 region of the 2D vibrational echo spectra as in figure 5. The off-diagonal peaks grow in together because the sample is in thermal equilibrium. The solid curves are from a fit to the data with one adjustable parameter, τd, using the kinetic model. Other parameters in the model are determined from independent experiments. For the phenol-toluene system τd = 15 ± 3 ps.
Figure 7
Figure 7
2D-IR vibrational echo spectra of the OD stretch of phenol in a series of mixed benzene derivative-CCl4 solvents with the same reaction time period, Tw = 7ps. The data have been normalized to the largest peak for each sample. Each contour represents a 10% change in amplitude. From left to right the hydrogen bonds are weaker and the size of the off-diagonal peaks are larger (more exchange).
Figure 8
Figure 8
The hydrogen bond lifetimes (1/kd, ps) plotted vs. exp (ΔH0/RT) where ΔH0 is the hydrogen bond dissociation enthalpy (negative of the enthalpy of formation), R is the gas constant, and T is the temperature (300 K). The line through the data is given by equation 4.

References

    1. Vinogradov SN, Linnell RH. Hydrogen Bonding. Van Nostrand Reinhold Company; New York: 1971.
    1. Joesten MD, Schaad LJ. Hydrogen Bonding. Marcel Dekker, Inc.; New York: 1974.
    1. Jeffrey GA. An Introduction to Hydrogen Bonding. Oxford University Press, Inc.; New York: 1997.
    1. Desiraju GR, Steiner T. The Weak Hydrogen Bond. Oxford; New York: 1999.
    1. Pimentel GC, McClella Al. Ann Rev Phys Chem. 1971;22:347–385.

Publication types