. 2007 Apr;5(4):e116.
doi: 10.1371/journal.pbio.0050116.

Fly photoreceptors demonstrate energy-information trade-offs in neural coding

Affiliations

Fly photoreceptors demonstrate energy-information trade-offs in neural coding

Jeremy E Niven et al. PLoS Biol. 2007 Apr.

Abstract

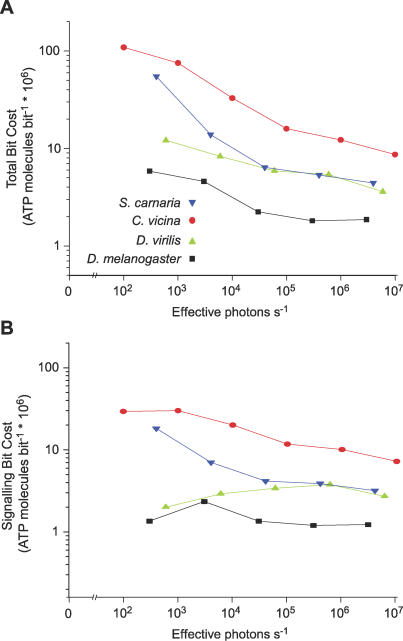
Trade-offs between energy consumption and neuronal performance must shape the design and evolution of nervous systems, but we lack empirical data showing how neuronal energy costs vary according to performance. Using intracellular recordings from the intact retinas of four flies, Drosophila melanogaster, D. virilis, Calliphora vicina, and Sarcophaga carnaria, we measured the rates at which homologous R1-6 photoreceptors of these species transmit information from the same stimuli and estimated the energy they consumed. In all species, both information rate and energy consumption increase with light intensity. Energy consumption rises from a baseline, the energy required to maintain the dark resting potential. This substantial fixed cost, approximately 20% of a photoreceptor's maximum consumption, causes the unit cost of information (ATP molecules hydrolysed per bit) to fall as information rate increases. The highest information rates, achieved at bright daylight levels, differed according to species, from approximately 200 bits s(-1) in D. melanogaster to approximately 1,000 bits s(-1) in S. carnaria. Comparing species, the fixed cost, the total cost of signalling, and the unit cost (cost per bit) all increase with a photoreceptor's highest information rate to make information more expensive in higher performance cells. This law of diminishing returns promotes the evolution of economical structures by severely penalising overcapacity. Similar relationships could influence the function and design of many neurons because they are subject to similar biophysical constraints on information throughput.


Conflict of interest statement

Competing interests. The authors have declared that no competing interests exist.

Figures

Figure 1
Figure 1. Intracellular Recordings of Voltage Responses and the Distribution of Information across Frequencies in R1–6 Photoreceptors of D. melanogaster and S. carnaria
(A) Quantum bumps (*) recorded from D. melanogaster in response to continuous illumination by the white-noise stimulus (lower trace, grey), which was attenuated by 5.5 log units to give a mean effective photon rate of 9 s−1. (B) Average responses of a D. melanogaster R1–6 photoreceptor to 50 repetitions of a randomly modulated light of mean contrast 0.32. (C) The corresponding average response of an R1–6 photoreceptor from S. carnaria. Note that the responses in (B) and (C) have dissimilar waveforms because they were generated by different random sequences of intensity modulation, shown in grey beneath each voltage record. In both (B) and (C) the mean stimulus intensity was set to approximately 5 × 10⁶ effective photons s−1. Note that S. carnaria R1–6 responses (C) vary more rapidly than D. melanogaster (B). (D) This faster response gave the S. carnaria R1–6 a wider bandwidth, as demonstrated in (D) by plotting the distribution of information across response frequency for the two cells.
Figure 2
Figure 2. Comparison of Information Rates in R1–6 Photoreceptors from Four Dipteran Species
Information rates (mean ± standard error of the mean) are measured from the response to a randomly modulated light of mean contrast 0.32, presented at five background (average) light levels to: S. carnaria (blue), C. vicina (red), D. virilis (green), and D. melanogaster (black). Each adapting light background was converted to effective photons s−1 to allow the photoreceptors to be compared under equivalent conditions.
Figure 3
Figure 3. Measurements of Photoreceptor Membrane Properties Allow the Calculation of Metabolic Cost
(A) The membrane potential (mean ± standard error of the mean) of R1–6 photoreceptors in the dark and at different effective photon rates, measured in four species S. carnaria (blue), C. vicina (red), D. virilis (green), and D. melanogaster (black). (B) The corresponding resistances (mean ± standard error of the mean) of R1–6 photoreceptor in the dark and at different effective photon rates. (C) The electrical model circuit of the photoreceptors. The model calculates from the measurements of membrane potential and resistance the rate at which the Na+/K+ pump, P, hydrolyses ATP molecules: g L = light-gated conductance; E L = reversal potential for light-gated current; i L = light-gated current; g K = potassium conductance; E K = potassium reversal potential; i K = potassium current. (D) The rate of hydrolysis of ATP molecules calculated at each effective photon rate for R1–6 photoreceptor of the four species (mean).
Figure 4
Figure 4. The Relationship between the Signalling Cost and the Fixed (Dark) Cost for R1–6 Photoreceptors from the Four Species S. carnaria, C. vicina, D.virilis, and D. melanogaster
(A) The rate of hydrolysis of ATP molecules during signalling at each effective photon rate. (B) The maximum signalling cost versus the fixed cost for each of the four R1–6 photoreceptor types. The maximum is the signalling cost measured at the brightest light levels. (C) The ratio of total cost to fixed cost of each photoreceptor type at each effective photon rate.
Figure 5
Figure 5. The Metabolic Cost of Information Decreases with Increasing Light Intensity
(A) A double logarithmic plot of metabolic cost per bit at each effective photon rate and (B) a double logarithmic plot of the metabolic cost of signalling per bit at each effective photon rate are shown. Measurements are from R1–6 photoreceptors from four species, S. carnaria (blue), C. vicina (red), D. virilis (green), and D. melanogaster (black).
Figure 6
Figure 6. The Metabolic Cost of Information in R1–6 Photoreceptors Decreases When the Information Rate Is Increased by Raising the Light Level
(A) The metabolic cost per bit plotted logarithmically versus the bit rate for R1–6 photoreceptors of the four species S. carnaria (blue), C. vicina (red), D. virilis (green), and D. melanogaster (black). (B) The metabolic cost of signalling per bit plotted logarithmically versus the bit rate for R1–6 photoreceptors in the four species.
Figure 7
Figure 7. The Scaling of Metabolic Cost with Performance in Dipteran R1–6 Photoreceptors
The logarithms of the total cost (open symbols) and the fixed cost (solid symbols) are plotted against the logarithm of maximum information rate. Costs are in ATP molecules hydrolysed per photoreceptor per second. Each data point represents the mean values from R1–6 photoreceptors in one of the four dipteran species used in this study. The linear fits suggest that the total cost of photoreceptor signalling (dashed line) increases as (information rate)1.7, and the fixed cost of maintaining the photoreceptor in the dark (solid line) increases as (information rate)1.47.

References

    1. Krebs JR, Davies NB. An introduction to behavioural ecology. Oxford: Blackwell Scientific; 1993. 420
    1. Alexander RM. Optima for animals. Princeton: Princeton University Press; 1996. 169
    1. Andersson M. Female choice selects for extreme tail length in a widowbird. Nature. 1982;299:818–820.
    1. Balmford A, Thomas ALR, Jones IL. Aerodynamics and the evolution of long tails in birds. Nature. 1993;361:628–631.
    1. Kaas JH. Why is brain size so important: Design problems and solutions as neocortex gets bigger or smaller. Brain Mind. 2000;1:7–23.