Comparative Study
. 2007 May;98(5):698-706.
doi: 10.1111/j.1349-7006.2007.00443.x. Epub 2007 Mar 21.

Genetic abnormalities involved in t(12;21) TEL-AML1 acute lymphoblastic leukemia: analysis by means of array-based comparative genomic hybridization

Affiliations
Comparative Study

Genetic abnormalities involved in t(12;21) TEL-AML1 acute lymphoblastic leukemia: analysis by means of array-based comparative genomic hybridization

Shinobu Tsuzuki et al. Cancer Sci. 2007 May.

Abstract

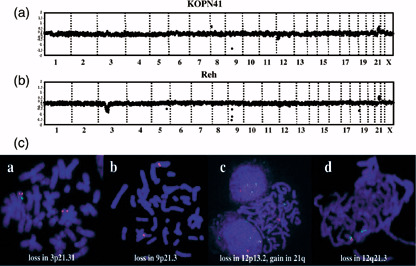
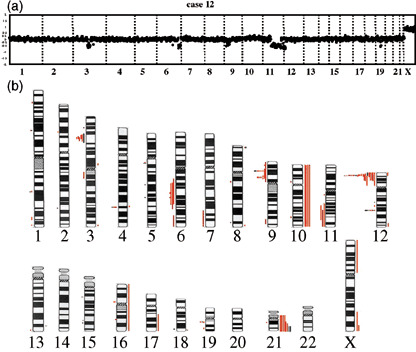
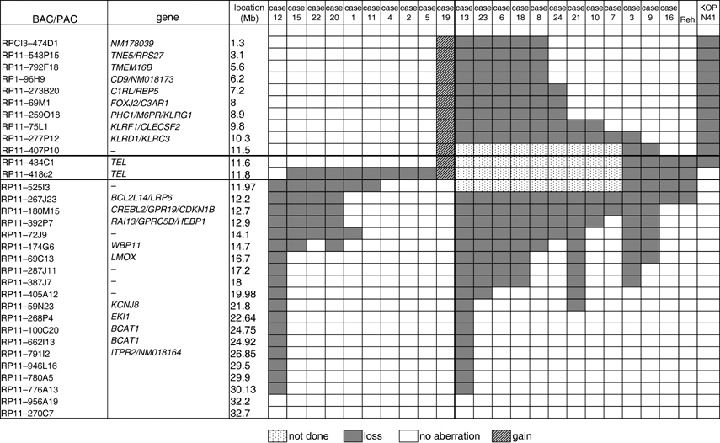
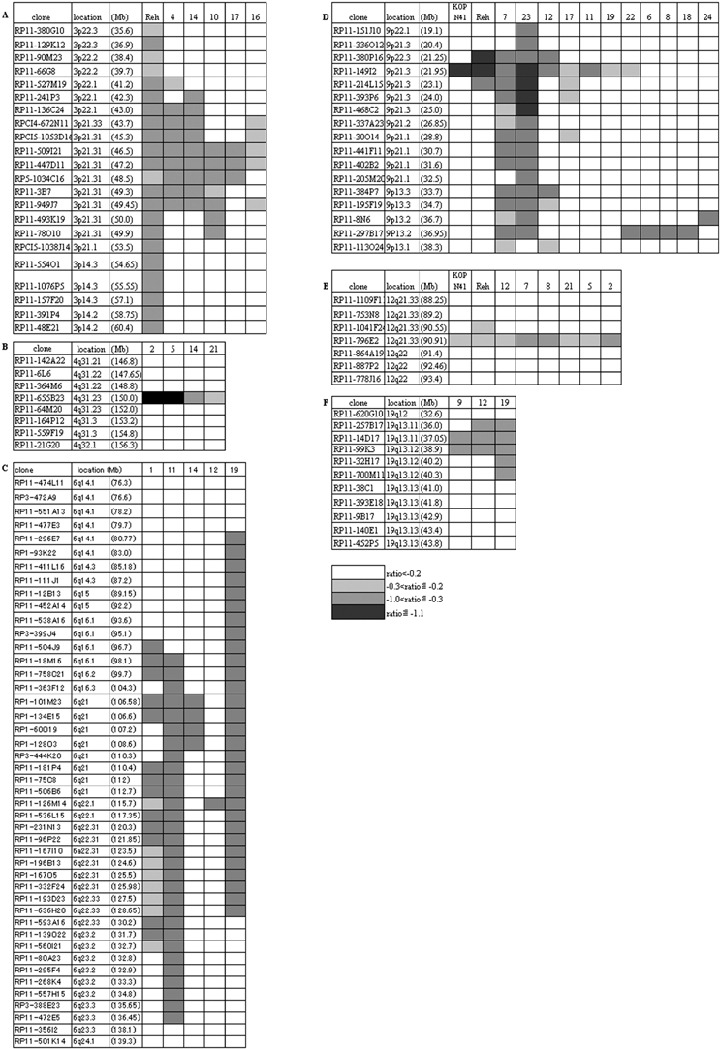
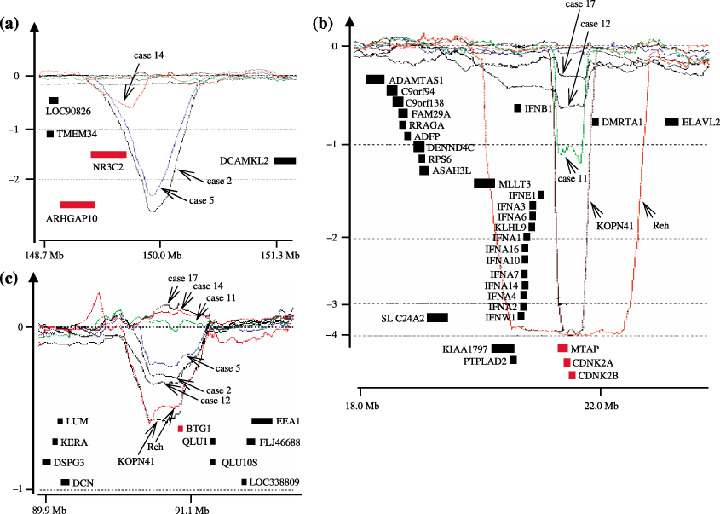
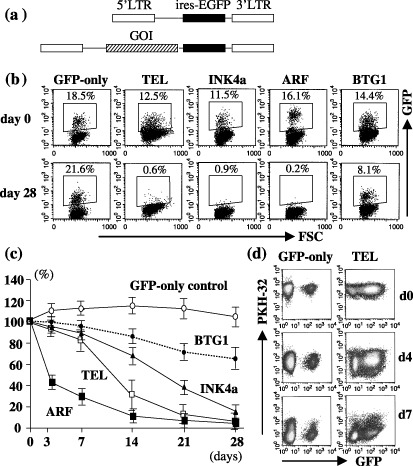
The TEL (ETV6)-AML1 (RUNX1) chimeric gene fusion is the most common genetic abnormality in childhood acute lymphoblastic leukemias. Evidence suggests that this chimeric gene fusion constitutes an initiating mutation that is necessary but insufficient for the development of leukemia. In a search for additional genetic events that could be linked to the development of leukemia, we applied a genome-wide array-comparative genomic hybridization technique to 24 TEL-AML1 leukemia samples and two cell lines. It was found that at least two chromosomal imbalances were involved in all samples. Recurrent regions of chromosomal imbalance (>10% of cases) and representative involved genes were gain of chromosomes 10 (17%) and 21q (25%; RUNX1) and loss of 12p13.2 (87%; TEL), 9p21.3 (29%; p16INK4a/ARF), 9p13.2 (25%; PAX5), 12q21.3 (25%; BTG1), 3p21 (21%; LIMD1), 6q21 (17%; AIM1 and BLIMP1), 4q31.23 (17%; NR3C2), 11q22-q23 (13%; ATM) and 19q13.11-q13.12 (13%; PDCD5). Enforced expression of TEL and to a lesser extent BTG1, both single genes known to be located in their respective minimum common region of loss, inhibited proliferation of the TEL-AML1 cell line Reh. Together, these findings suggest that some of the genes identified as lost by array-comparative genomic hybridization may partly account for the development of leukemia.


Figures

Figure 1
Figure 1
Array‐comparative genomic hybridization (CGH) profiles and fluorescent in situ hybridization (FISH) analysis of TEL–AML1 cell lines. Log2 ratios of signals of cell lines/sample versus normal control are plotted for all clones based on their chromosomal position, with chromosomes separated by vertical lines. Normal range of the log2 ratios are within ±0.2. Clones are arranged from chromosome 1–22 and X within each chromosome on the basis of the Sanger Center Mapping Position, July 2004 version. (a) In the KOPN41 cell line, chromosomal imbalances detected were loss of 9p21.3, 12p12.3‐pter and 12q21.3, and gain of 8p23.2 and 21q22.12‐qter. (b) In the Reh cell line, loss of 3p14.3‐p22.3, 5q23.2, 9p21.3, 12p13.2, 12q21.3 and 18q23, and gain of 21q22.12‐qter were detected. (c) FISH analyses of Reh cells for the indicated chromosomal imbalances. BAC clones used were (a) RP11‐509I21 (green) and RP11‐335I9 (red), (b) RP11‐149I2 (green) and RP11‐30O14 (red), (c) RP11‐71L1 (green) and RP11‐525I3 (red), and (d) RP11‐887P2 (green) and RP11‐796E2 (green). Loss of signals by RP11‐509I21 (3p21.31) in (a), RP11‐149I2 (9p21.3) in (b), RP11‐525I3 (12p13.2) in (c), a diminished signal by RP11‐796E2 (12q21.3) in (d), and an extra signal by RP11‐71L1 in (c) were clearly detected. Note that BAC RP11‐525I3 (12p13.2) used in (c) is not included in the array‐CGH analysis shown in (b), but is included in the contig‐array in Fig. 3, where the corresponding region of loss is presented.
Figure 2
Figure 2
Summary of chromosomal imbalances. (a) A representative array‐comparative genomic hybridization (CGH) profile of patient samples (case 12) is presented. Detected were loss of 3q11.2‐q13.13, 6q22.1, 6q25‐qter, 9p13.3, 9p21.3, 9p23, 11q14.1‐qter, 12p11.22‐p13.2, 12q21.33 and 19q13.11‐q13.12. (b) Chromosomal imbalances detected in all patient samples (red lines) and two cell lines (black lines) are presented. Regions of loss and gain are represented by vertical lines, on the left (loss) and right (gain) side of each ideogram.
Figure 3
Figure 3
Common region of loss at 12p13.2 region. Bacteria artificial chromosome and P1‐derived artificial chromosome (BAC/PAC) clones, their location, and the absence or presence of loss are shown in each case and cell line. Filled‐in and hatched boxes represent losses and gains, respectively. Dotted boxes indicate clones not tested.
Figure 4
Figure 4
Common region of loss at 3p21.3, 4q31.23, 6q21, 9p13.2, 9p21.3, 12q21.33 and 19q13.11‐q13.12 regions. Bacteria artificial chromosome and P1‐derived artificial chromosome (BAC/PAC) clones, their location, and the log2 ratios of signals of case/cell line versus normal control are presented as indicated.
Figure 5
Figure 5
Oligonucleotide array‐comparative genomic hybridization (CGH) profiles. DNA from cases 2, 5, 11, 12, 14, 17, and cell lines Reh and KOPN41 were used for the oligonucleotide array‐CGH analysis of the 4q21.23, 9p21.3 and 12q21.33 regions. Horizontal and vertical axes, respectively, represent the positions of the oligonucleotide probes and log2 ratios of the hybridized signals. Locations of genes are presented as solid bars, with the genes contained in the minimum region of loss shown in red.
Figure 6
Figure 6
Effect of enforced expression of TEL and BTG1 on growth of Reh cells. (a) Schematic drawing of the retroviral vectors used (not to scale). (b) Typical FACS profile showing green fluorescent protein (GFP) expression of Reh cells infected with the indicated virus. Note that the GFP‐control essentially displayed constant GFP expression over 28 days, in contrast to TEL‐, INK4a‐, Arf‐ and BTG1‐virus infected cells, where GFP expression decreased with time. (c) Time‐course of GFP expression. % GFP expression relative to that of day 0 is shown. Typical data of five independent experiments is presented together with the mean and SD of triplicate samples. (d) Inhibited cell division of TEL‐expressing Reh cells. Reh cells were infected with GFP‐only control‐viruses or TEL‐viruses, and immediately stained with PKH26 fluorescent dye. FACS profiles for GFP and PKH‐26 fluorescence of infected cells are shown. Two independent experiments yielded similar results.

References

    1. Greaves MF, Maia AT, Wiemels JL, Ford AM. Leukemia in twins: lessons in natural history. Blood 2003; 102: 2321–33. - PubMed
    1. Zelent A, Greaves M, Enver T. Role of the TEL–AML1 fusion gene in the molecular pathogenesis of childhood acute lymphoblastic leukaemia. Oncogene 2004; 23: 4275–83. - PubMed
    1. Bernardin F, Yang Y, Cleaves R et al. TEL‐AML1, expressed from t(12;21) in human acute lymphocytic leukemia, induces acute leukemia in mice. Cancer Res 2002; 62: 3904–8. - PubMed
    1. Tsuzuki S, Seto M, Greaves M, Enver T. Modeling first‐hit functions of the t(12;21) TEL–AML1 translocation in mice. Proc Natl Acad Sci USA 2004; 101: 8443–8. - PMC - PubMed
    1. Morrow M, Horton S, Kioussis D, Brady HJ, Williams O. TEL–AML1 promotes development of specific hematopoietic lineages consistent with preleukemic activity. Blood 2004; 103: 3890–6. - PubMed

Publication types

MeSH terms