

doi: 10.1021/pr060599n.
Epub 2007 Mar 22.
15N metabolic labeling of mammalian tissue with slow protein turnover
Affiliations
- PMID: 17375949
- PMCID: PMC2527585
- DOI: 10.1021/pr060599n
Item in Clipboard
15N metabolic labeling of mammalian tissue with slow protein turnover
J Proteome Res.
2007 May.
Abstract
We previously reported the metabolic 15N labeling of a rat where enrichment ranged from 94% to 74%. We report here an improved labeling strategy which generates 94% 15N enrichment throughout all tissues of the rat. A high 15N enrichment of the internal standard is necessary for accurate quantitation, and thus, this approach will allow quantitative mass spectrometry analysis of animal models of disease targeting any tissue.
Figures
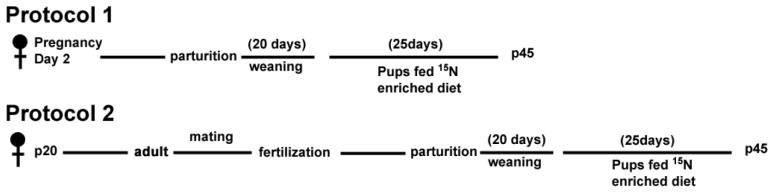
A, In protocol 1, a female rat on pregnancy day 2 (E2) was placed on the 15N enriched diet. It remained on the 15N diet during pregnancy and the weaning of its pups. After weaning, the pups were placed on the 15N diet for 25 days. B, In protocol 2, a weaned female rat was placed on a 15N diet and remained on the 15N diet during mating, pregnancy and the weaning of its pups. After weaning, the pups were placed on the 15N diet for 25 days.
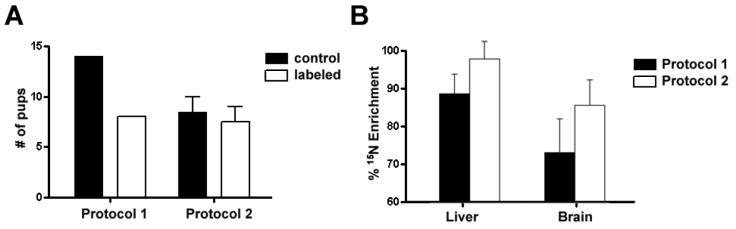
The white bars represent litters from 15N labeled rats and the black bars represent litters from rats on the control diet. In protocol 1, one pregnant rat was placed on the 15N diet and one pregnant rat on the control diet. In protocol 2, two female rats were placed on the 15N diet and two on the control diet before mating. B, The percent 15N enrichment of liver and brain tissues from maternal rats. The black bars represent tissues from a maternal rat from protocol 1 and the white boxes represent tissues from a maternal rat from protocol 2. Values represent averages +/- SD.
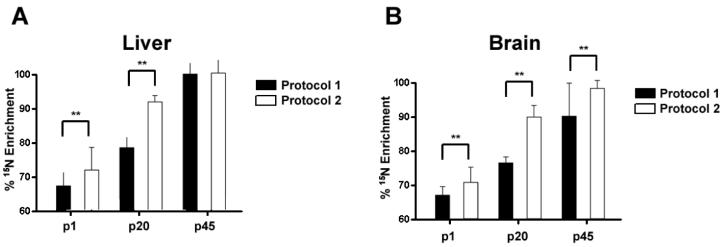
A, The percent 15N enrichment was determined for liver tissue at 3 developmental ages, p1, p20, and p45. There were significant differences (** p < .001) detected between the two enrichment protocol at p1 and p20, but no significant differences were detected at p45. B, The percent 15N enrichment was determined for brain tissue at 3 developmental ages, p1, p20, and p45. There were significant differences (** p < .001) detected between the two enrichment protocol at p1 and p20. In contrast to the liver tissue, there was a significant difference detected at p45 between the two enrichment protocols. Values represent averages +/- SD.
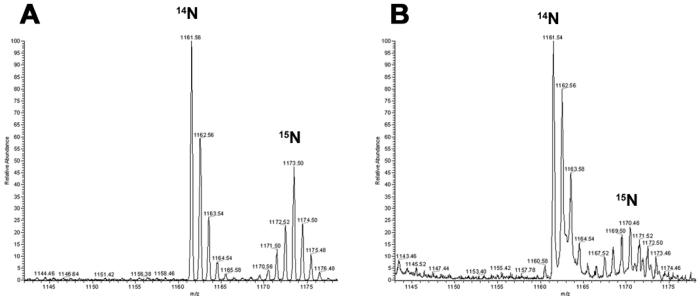
The peptide, K.EITALAPSTMK.I, was identified in both p45 (A) and p1 (B) brain samples from protocol 2. The peptide was measured to be 95% enriched in the p45 sample and 68% enriched in the p1 sample. The isotopic distribution of the 14N peptide is identical in both mass spectra with the major peak at 1161.5 m/z, but the isotopic distribution for the 15N peptide is different between the two samples. The major isotopic peak of the 15N peptide in p45 is at 1173.5 m/z, while it is at 1170.5 m/z in p1. In addition, the 15N isotopic distribution is broader, less intense in p1 compared to p45. The y-axis is relative abundance and the x-axis is mass/charge.
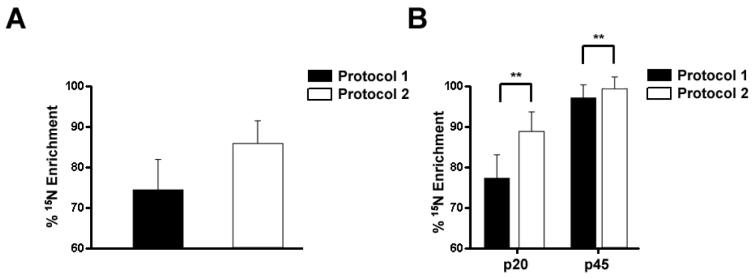
A, The percent 15N enrichment was determined for skeletal muscle from the maternal rats. Consistent with other maternal tissues, the percent enrichment of skeletal muscle was greater from the maternal rat from protocol 2 compared to protocol 1. B, The percent 15N enrichment was determined for skeletal muscle at p20, and p45. There were significant differences (** p < .001) detected between the two enrichment protocol both at p20 and p45. Values represent averages +/- SD.
References
-
- Conrads TP, Alving K, Veenstra TD, Belov ME, Anderson GA, Anderson DJ, Lipton MS, Pasa-Tolic L, Udseth HR, Chrisler WB, Thrall BD, Smith RD. Quantitative analysis of bacterial and mammalian proteomes using a combination of cysteine affinity tags and 15N-metabolic labeling. Anal Chem. 2001;73(9):2132–9. - PubMed
-
- MacCoss MJ, Wu CC, Liu H, Sadygov R, Yates JR., 3rd A correlation algorithm for the automated quantitative analysis of shotgun proteomics data. Anal Chem. 2003;75(24):6912–21. - PubMed
-
- Pan C, Kora G, McDonald WH, Tabb DL, Verberkmoes NC, Hurst GB, Pelletier DA, Samatova NF, Hettich RL. ProRata: A Quantitative Proteomics Program for Accurate Protein Abundance Ratio Estimation with Confidence Interval Evaluation. Anal Chem. 2006;78(20):7121–7131. - PubMed
-
- Gruhler A, Olsen JV, Mohammed S, Mortensen P, Faergeman NJ, Mann M, Jensen ON. Quantitative phosphoproteomics applied to the yeast pheromone signaling pathway. Mol Cell Proteomics. 2005;4(3):310–27. - PubMed
Publication types
MeSH terms
Substances
Grants and funding
LinkOut - more resources
Full Text Sources
Other Literature Sources
Molecular Biology Databases
