. 2007 Apr;6(2):235-44.
doi: 10.1111/j.1474-9726.2007.00281.x.

On the evolutionary origin of aging

Affiliations

On the evolutionary origin of aging

Martin Ackermann et al. Aging Cell. 2007 Apr.

Abstract

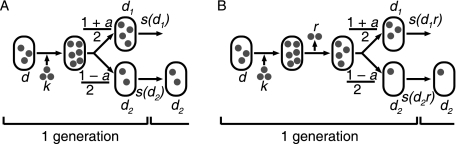
It is generally believed that the first organisms did not age, and that aging thus evolved at some point in the history of life. When and why this transition occurred is a fundamental question in evolutionary biology. Recent reports of aging in bacteria suggest that aging predates the emergence of eukaryotes and originated in simple unicellular organisms. Here we use simple models to study why such organisms would evolve aging. These models show that the differentiation between an aging parent and a rejuvenated offspring readily evolves as a strategy to cope with damage that accumulates due to vital activities. We use measurements of the age-specific performance of individual bacteria to test the assumptions of the model, and find evidence that they are fulfilled. The mechanism that leads to aging is expected to operate in a wide range of organisms, suggesting that aging evolved early and repeatedly in the history of life. Aging might thus be a more fundamental aspect of cellular organisms than assumed so far.


Figures

Fig. 1
Fig. 1
Outline of the model. (A) At the beginning of a generation, an individual contains some amount of damage d, represented by grey dots. It accumulates a further amount of damage, k, so that it contains a total amount of damage d + k before division. At division, the damage is divided among the progeny with a degree of asymmetry controlled by the parameter a. One of the progeny (top) obtains a fraction 0.5 * (1 + a) (d + k) (denoted as d1) of the damage, while the other obtains a fraction 0.5 * (1 – a) (d + k) (denoted as d2). After division, mortality is imposed. The first progeny survives with probability s(d1), the second with probability s(d2). In the example, the first progeny dies, and the second survives. All surviving progeny constitute the population at the beginning of the next generation. In the figure, damage is represented as discrete entities for simplicity; in the model, the amount of damage is a continuous quantity. (B) The model with repair. After accumulating an amount of damage k, the cell repairs part of the damage, r, so that the total amount of damage before division is d + kr. The first progeny obtains a fraction 0.5 * (1 + a) (d + kr) (denoted as d1) of the damage, the second progeny a fraction 0.5 * (1 – a) (d + kr) (denoted as d2). The first progeny survives with probability s(d1,r), the second with probability s(d2,r).
Fig. 2
Fig. 2
Evolution of asymmetric distribution of damage depends on the relationship between damage and survival. Asymmetric distribution of damage is favored if the relationship between the damage d inherited by a progeny and the chance s(d) that it survives to the next cell division is linear [0.5 s(d) = 1 − d/d0; d0 = 10]. A cell with damage 10 can distribute its damage symmetrically to produce two progeny with damage d = 5 and survival s(5) = 0.5 (blue arrows). Alternatively, it can divide asymmetrically, for example, producing a progeny with damage d = 2 and survival s(2) = 0.8, and a second progeny with damage d = 8 and survival s(8) = 0.2 (red arrows). The expected number of surviving progeny is one, independently of the level of asymmetry. However, asymmetric damage distribution increases the average quality of the surviving offspring. The expected sum of damage in the surviving progeny is 5 (0.5 * 5 + 0.5 * 5) with symmetry, but only 3.2 (0.8 * 2 + 0.2 * 8) with asymmetry (calculated as shown on the right side of the graph). (B) This advantage for asymmetric distribution of damage drives the evolution of asymmetry in a population with initially symmetric damage distribution. The graph shows results of the simulation model see Experimental procedures; population size N = 10 000, d0 = 10, damage accumulation k = 5, mutation rate µa = 0.001, mutation size σa = 0.01). This example shows a typical outcome where full asymmetry is fixed within 20 000 generations.
Fig. 3
Fig. 3
The advantage of asymmetry decreases for damage-survival curves that are concave down. (A) Six different damage-survival curves of the form 1 − c · d/d0 – (1 – c) (d/d0)4 are investigated; c is varied from 0 to 1 in increments of 0.2 (d0 = 10). (B) For each of the six curves from C, fitness is calculated as a function of the asymmetry of damage distribution (k = 5). For c = 0.4 fitness is largely independent of the level of asymmetry. To calculate the fitness of a phenotype with a given asymmetry under a defined damage-cost curve, we used the simulation model to determine the average fitness of monomorphic populations (see Experimental procedures).
Fig. 4
Fig. 4
Interactions between asymmetric distribution of damage and repair. (A) Results of the simulation model when the level of asymmetry of damage distribution and the investment in repair were evolving phenotypic traits (population size N = 2000, d0 = 10, r0 = 10, k = 5, µa = 0.001, µr = 0.001, σa = 0.01, σr = 0.05). For the first 50 000 generations, asymmetry was kept at zero, and the investment in repair evolved to an equilibrium value. After generation 50 000, asymmetry was free to evolve and increased to a value of one, while the investment in repair decreases. (B) The fitness landscape for the situation described under A. The evolutionary interaction between asymmetry and repair is represented in the shape of the fitness landscape. With increasing asymmetry, the strength of selection for reduced repair increases (the slope in direction of reduced repair is steeper for larger asymmetry). On the other hand, with decreasing repair the strength of selection for more asymmetry increases. There is one global maximum at minimal repair and maximal asymmetry.
Fig. 5
Fig. 5
Decrease in fitness components with increasing age in cells of the bacterium Caulobacter crescentus. Reproductive function (moving average, window size 5 h) as a function of the cell age. Depicted are data from nine independent experiments where cohorts of 30 cells of C. crescentus were followed to an age of 60 h (corresponding to about 25 cell divisions), with the quadratic best fit. Both the quadratic and the linear term are significant (P < 0.001).

References

    1. Ackermann M, Stearns SC, Jenal U. Senescence in a bacterium with asymmetric division. Science. 2003;300:1920. - PubMed
    1. Aguilaniu H, Gustafsson L, Rigoulet M, Nystrom T. Asymmetric inheritance of oxidatively damaged proteins during cytokinesis. Yeast. 2003;20:S303–S303. - PubMed
    1. Ameisen JC. Looking for death at the core of life in the light of evolution. Cell Death Differ. 2004;11:4–10. - PubMed
    1. Ashok BT, Ali R. The aging paradox: free radical theory of aging. Exp. Gerontol. 1999;34:293–303. - PubMed
    1. Barker MG, Walmsley RM. Replicative ageing in the fission yeast Schizosaccharomyces pombe. Yeast. 1999;15:1511–1518. - PubMed

Publication types