. 2007 Jul;121(3):383-91.
doi: 10.1111/j.1365-2567.2007.02586.x. Epub 2007 Mar 22.

Induction of T-cell activation or anergy determined by the combination of intensity and duration of T-cell receptor stimulation, and sequential induction in an individual cell

Affiliations

Induction of T-cell activation or anergy determined by the combination of intensity and duration of T-cell receptor stimulation, and sequential induction in an individual cell

Tomohiro Yamamoto et al. Immunology. 2007 Jul.

Abstract

It has been shown that anergic T cells have important roles in peripheral tolerance, although the precise mechanism for inducing anergy is still unclear. We analysed the kinetics of anergy induction at an individual cell level by flow cytometry. We first successfully obtained T helper type 1 (Th1) cells that had been made uniform with the level of interferon-gamma (IFN-gamma) production induced by antigen stimulation. We then used these Th1 cells to evaluate the degree of anergy for each Th1 cell treated with an anti-CD3 monoclonal antibody according to the level of IFN-gamma secretion. Our results demonstrate that anergic stimulation could induce both activation and anergy, depending on the duration and intensity of stimulation at the level of an individual cell. Each Th1 cell was first activated and then gradually became anergic depending on the duration of stimulation. The duration of the stimulus required for inducing anergy became shorter as the intensity of stimulation became stronger. We also show that the calcineurin signal controlled the induction of activation or anergy depending on the activity. This study contributes to better understanding of the precise mechanism for inducing T-cell anergy.


Figures

Figure 2
Figure 2
Time–course analysis of IFN-γ secretion by Th1 cells. Th1 cells were restimulated with OVA (1 mg/ml) and APC. The supernatant was collected from the culture at each indicated time after stimulation. IFN-γ in the supernatant was measured by ELISA. Each bar represents the concentration of IFN-γ accumulated from the beginning of the culture to that time. The results are representative of two independent experiments.
Figure 7
Figure 7
Two hypothetical models for the T-cell response during anergy induction. These figures show the putative flow cytometry charts obtained when each hypothetical model response would occur during anergy induction. (a) T cells become anergic after being subjected to anergic stimulation that exceeds a threshold level, there being two definitely distinct T cells in the population: normal and anergic. The numbers of anergic T cells increase while the induction of anergy is in progress. (b) Each T cell gradually becomes anergic while the induction of anergy is in progress. The response of each T cell in the population is comparatively uniform. There is no threshold level between the normal and anergic states.
Figure 1
Figure 1
IFN-γ production by T cells stimulated several times with the antigen. Naive T cells of DO.11.10 were stimulated with antigen in the presence of IL-12 for the indicated number of times. Naive T cells (a), cells stimulated once (b), cells stimulated twice (c), and cells stimulated three times (d) were restimulated with OVA (1 mg/ml) and APC. The IFN-γ production by those T cells was analysed by flow cytometry. The data shown indicate KJ1-26-positive cells. The results are representative of two independent experiments.
Figure 3
Figure 3
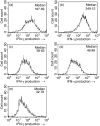
IFN-γ production by T cells treated with various concentrations of the anti-CD3 mAb. Th1 cells were stimulated for 24 hr in wells that had been precoated with the indicated concentrations of the anti-CD3 mAb: (a) 0 μg/ml, (b) 0·01 μg/ml, (c) 0·1 μg/ml, (d) 1 μg/ml, (e) 10 μg/ml. After allowing the cells to rest for 3 days, IFN-γ secreted by the Th1 cells when restimulated with OVA (1 mg/ml) and APC was analysed by flow cytometry. The data shown indicate KJ1-26-positive cells. These results are representative of three independent experiments.
Figure 4
Figure 4
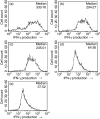
IFN-γ production by T cells treated with a high concentration of the anti-CD3 mAb for various times. Th1 cells were treated for the indicated times in wells that had been precoated with 10 μg/ml of the anti-CD3 mAb: (a) untreated, (b) 3 hr, (c) 6 hr, (d) 9 hr, (e) 15 hr. After allowing the cells to rest for 3 days, IFN-γ secreted by Th1 cells that had been restimulated with OVA (1 mg/ml) and APC were analysed by flow cytometry. The data shown indicate KJ1-26-positive cells. These results are representative of two independent experiments.
Figure 5
Figure 5
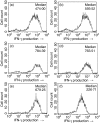
IFN-γ production by T cells treated with a medium concentration of the anti-CD3 mAb for various times. Th1 cells were treated for the indicated times in wells that had been precoated with 1 μg/ml of the anti-CD3 mAb: (a) untreated, (b) 0·5 hr, (c) 1 hr, (d) 2 hr, (e) 3 hr, (f) 5 hr. After being allowed to rest for 3 days, IFN-γ secreted by Th1 cells that had been restimulated by OVA (1 mg/ml) and APC was analysed by flow cytometry. The data shown indicate KJ1-26-positive cells. These results are representative of two independent experiments.
Figure 6
Figure 6
Effect of the dosage of cyclosporin A on the anti-CD3 mAb-induced activation and anergy. Th1 cells were treated with the anti-CD3 mAb (5 μg/ml) in the presence of each inhibitor (PD98059, PD; SB203580, SB; JNK inhibitor-I, JNK; cyclosporin A, CsA). After being allowed to rest for 5 days, the Th1 cells were restimulated with OVA (1 mg/ml) and APC. IFN-γ in the culture supernatant was measured by ELISA 3 days after the restimulation. These results are representative of two independent experiments (*P < 0·05).
Figure 8
Figure 8
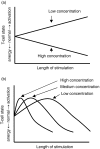
Two possible roles of the intensity and length of stimulation in anergy induction. These figures show the states of T cells during anergy induction. The state of the T cells was normal before anergic stimulation in both models. (a) The state of the T cells gradually changes to being activated when the cells are continuously given a low level of anergic stimulation, while it changes to anergic when the cells are continuously given a high level of anergic stimulation. (b) The state of the T cells gradually changes to be activated and then to anergic regardless of the level of anergic stimulation. On the other hand, the time necessary for changing their states increases as the level of anergic stimulation becomes weaker.

References

    1. Rellahan BL, Jones LA, Kruisbeek AM, Fry AM, Matis LA. In vivo induction of anergy in peripheral Vβ 8+ T cells by staphylococcal enterotoxin B. J Exp Med. 1990;172:1091–100. - PMC - PubMed
    1. Melamed D, Friedman A. Direct evidence for anergy in T lymphocytes tolerized by oral administration of ovalbumin. Eur J Immunol. 1993;23:935–42. - PubMed
    1. Melamed D, Fishman-Lovell J, Uni Z, Weiner HL, Friedman A. Peripheral tolerance of Th2 lymphocytes induced by continuous feeding of ovalbumin. Int Immunol. 1996;8:717–24. - PubMed
    1. Salojin KV, Zhang J, Madrenas J, Delovitch TL. T-cell anergy and altered T-cell receptor signaling: effects on autoimmune disease. Immunol Today. 1998;19:468–73. - PubMed
    1. Whitacre CC, Gienapp IE, Orosz CG, Bitar DM. Oral tolerance in experimental autoimmune encephalomyelitis. III. Evidence for clonal anergy. J Immunol. 1991;147:2155–63. - PubMed

LinkOut - more resources