. 2007 Mar 21:8:98.
doi: 10.1186/1471-2105-8-98.

Including probe-level uncertainty in model-based gene expression clustering

Affiliations

Including probe-level uncertainty in model-based gene expression clustering

Xuejun Liu et al. BMC Bioinformatics. .

Abstract

Background: Clustering is an important analysis performed on microarray gene expression data since it groups genes which have similar expression patterns and enables the exploration of unknown gene functions. Microarray experiments are associated with many sources of experimental and biological variation and the resulting gene expression data are therefore very noisy. Many heuristic and model-based clustering approaches have been developed to cluster this noisy data. However, few of them include consideration of probe-level measurement error which provides rich information about technical variability.

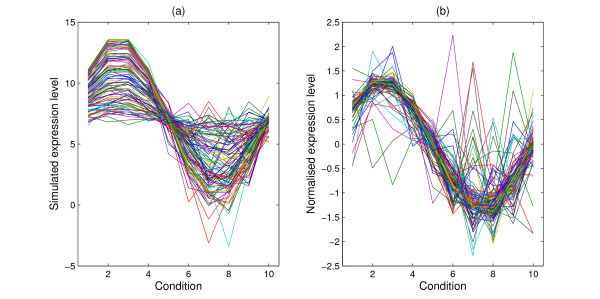
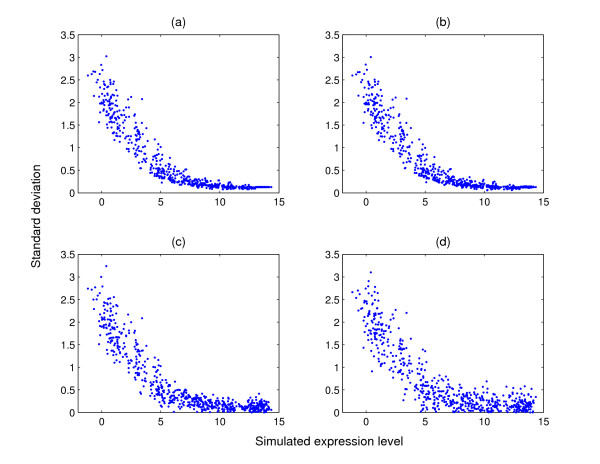
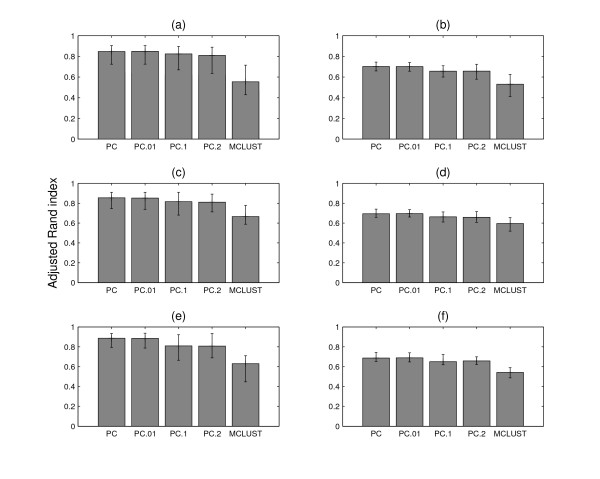
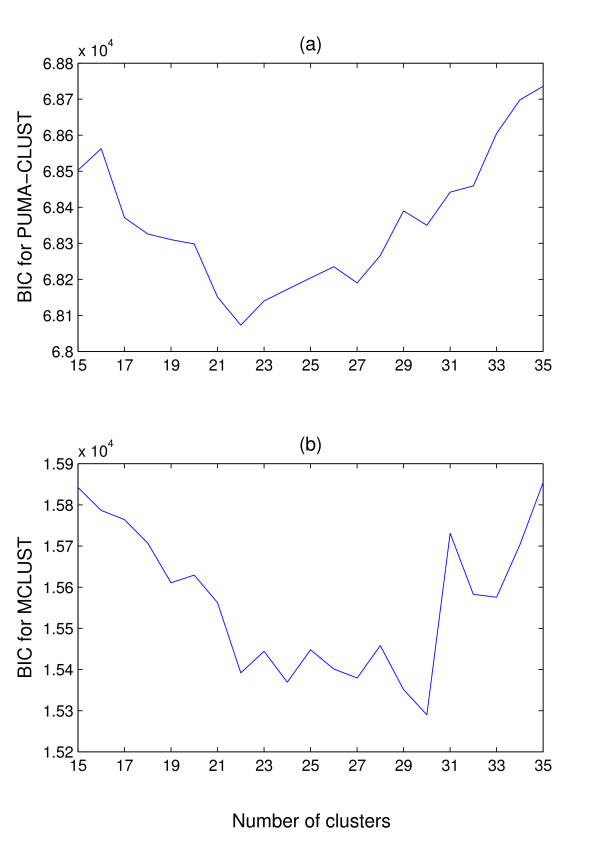
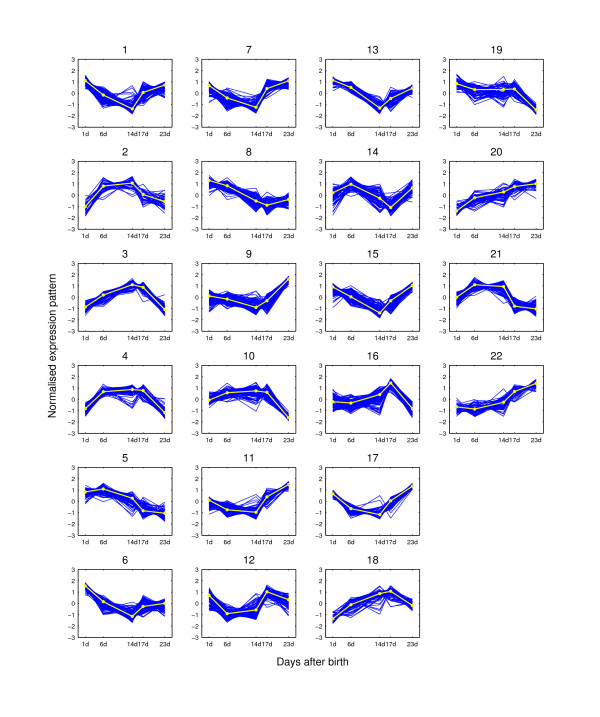
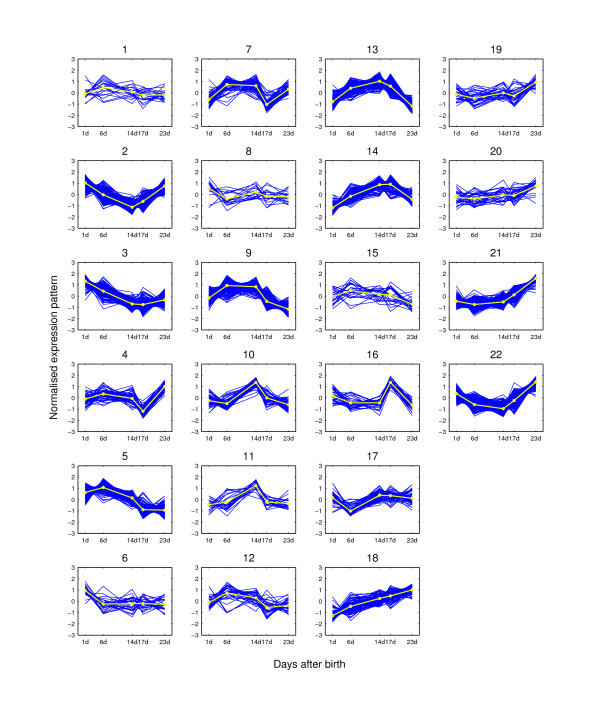
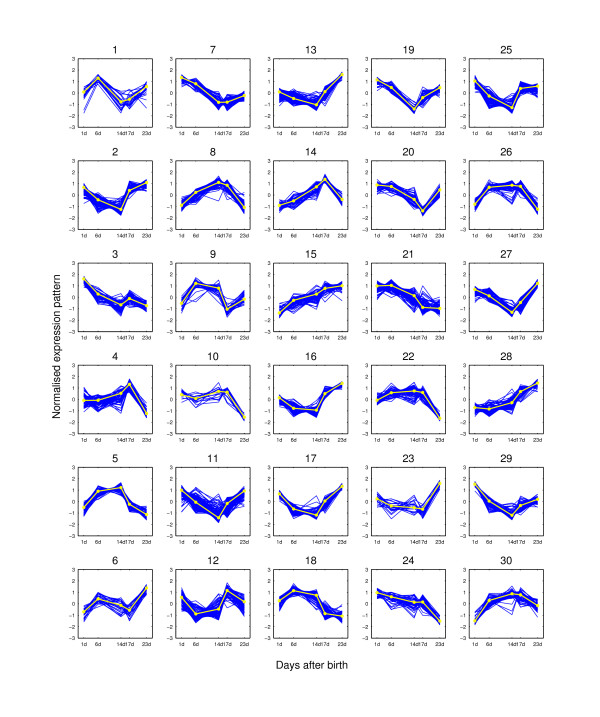
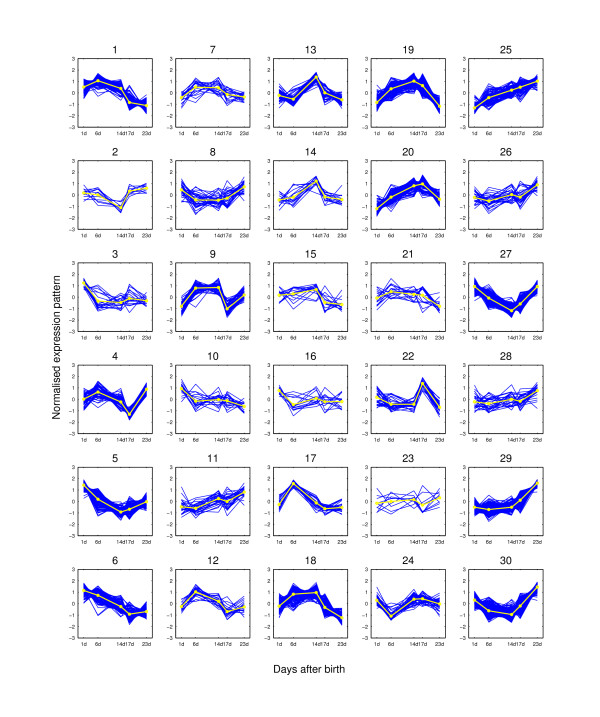
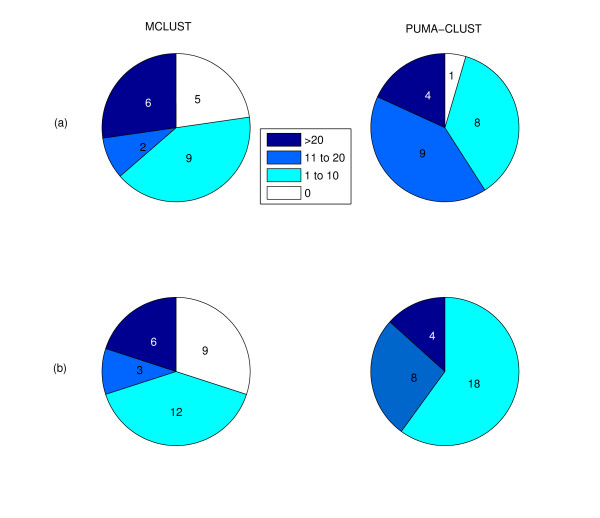
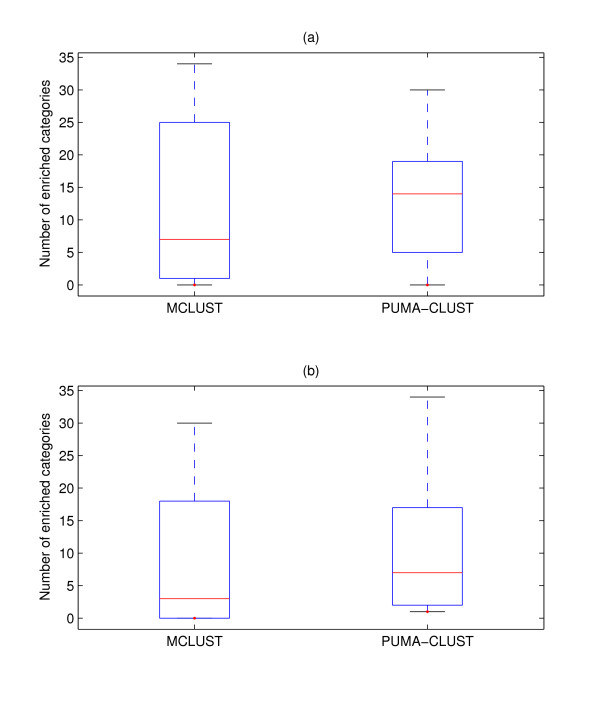
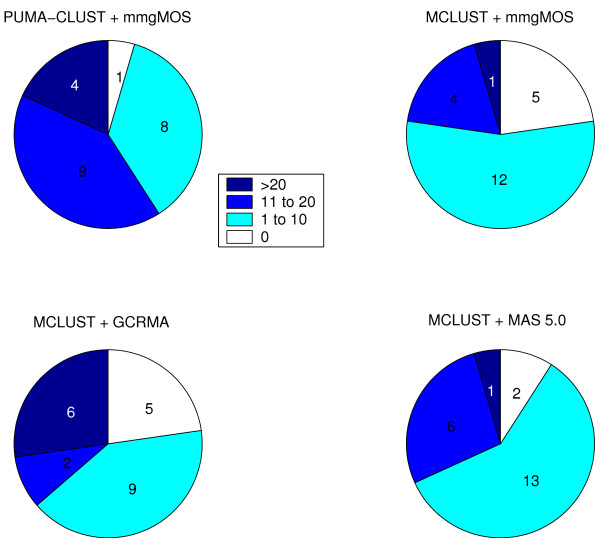
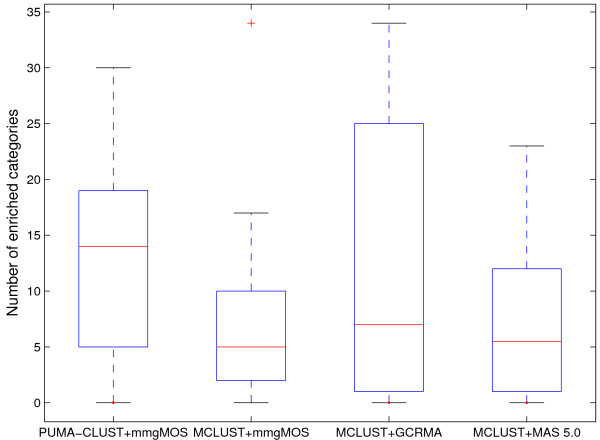
Results: We augment a standard model-based clustering method to incorporate probe-level measurement error. Using probe-level measurements from a recently developed Affymetrix probe-level model, multi-mgMOS, we include the probe-level measurement error directly into the standard Gaussian mixture model. Our augmented model is shown to provide improved clustering performance on simulated datasets and a real mouse time-course dataset.

Conclusion: The performance of model-based clustering of gene expression data is improved by including probe-level measurement error and more biologically meaningful clustering results are obtained.


Figures

Figure 1
Figure 1
Simulated expression profiles. Simulated expression profiles for one group under 10 conditions. (a) are the raw data on a log scale and (b) are the normalised profiles with zero mean and standard deviation one.
Figure 2
Figure 2
Standard deviation against the simulated gene expression level. Scatter plots of standard deviation against the simulated gene expression level. The standard deviation in (a) is sampled from the multi-mgMOS results obtained from the mouse dataset. The standard deviation is randomly changed by adding a noise drawn from (b) N MathType@MTEF@5@5@+=feaafiart1ev1aaatCvAUfKttLearuWrP9MDH5MBPbIqV92AaeXatLxBI9gBamrtHrhAL1wy0L2yHvtyaeHbnfgDOvwBHrxAJfwnaebbnrfifHhDYfgasaacH8akY=wiFfYdH8Gipec8Eeeu0xXdbba9frFj0=OqFfea0dXdd9vqai=hGuQ8kuc9pgc9s8qqaq=dirpe0xb9q8qiLsFr0=vr0=vr0dc8meaabaqaciaacaGaaeqabaWaaeGaeaaakeaaimaacqWFneVtaaa@383B@(0, 0.01), (c) N MathType@MTEF@5@5@+=feaafiart1ev1aaatCvAUfKttLearuWrP9MDH5MBPbIqV92AaeXatLxBI9gBamrtHrhAL1wy0L2yHvtyaeHbnfgDOvwBHrxAJfwnaebbnrfifHhDYfgasaacH8akY=wiFfYdH8Gipec8Eeeu0xXdbba9frFj0=OqFfea0dXdd9vqai=hGuQ8kuc9pgc9s8qqaq=dirpe0xb9q8qiLsFr0=vr0=vr0dc8meaabaqaciaacaGaaeqabaWaaeGaeaaakeaaimaacqWFneVtaaa@383B@(0, 0.1) and (d) N MathType@MTEF@5@5@+=feaafiart1ev1aaatCvAUfKttLearuWrP9MDH5MBPbIqV92AaeXatLxBI9gBamrtHrhAL1wy0L2yHvtyaeHbnfgDOvwBHrxAJfwnaebbnrfifHhDYfgasaacH8akY=wiFfYdH8Gipec8Eeeu0xXdbba9frFj0=OqFfea0dXdd9vqai=hGuQ8kuc9pgc9s8qqaq=dirpe0xb9q8qiLsFr0=vr0=vr0dc8meaabaqaciaacaGaaeqabaWaaeGaeaaakeaaimaacqWFneVtaaa@383B@(0, 0.2).
Figure 3
Figure 3
Average adjusted Rand index. The average adjusted Rand index of the clustering results from PUMA-CLUST and MCLUST on the simulated data. The first column is for the six group dataset and the second column is for the seven group dataset with one noise group added. The upper panel shows results on datasets with 10 conditions, the middle panel is for 20 conditions and the lower panel is for 30 conditions. PC represents PUMA-CLUST results on the original simulated data. PC.01, PC.1 and PC.2 represent the PUMA-CLUST results on the datasets with added noise drawn from N MathType@MTEF@5@5@+=feaafiart1ev1aaatCvAUfKttLearuWrP9MDH5MBPbIqV92AaeXatLxBI9gBamrtHrhAL1wy0L2yHvtyaeHbnfgDOvwBHrxAJfwnaebbnrfifHhDYfgasaacH8akY=wiFfYdH8Gipec8Eeeu0xXdbba9frFj0=OqFfea0dXdd9vqai=hGuQ8kuc9pgc9s8qqaq=dirpe0xb9q8qiLsFr0=vr0=vr0dc8meaabaqaciaacaGaaeqabaWaaeGaeaaakeaaimaacqWFneVtaaa@383B@(0, 0.01), N MathType@MTEF@5@5@+=feaafiart1ev1aaatCvAUfKttLearuWrP9MDH5MBPbIqV92AaeXatLxBI9gBamrtHrhAL1wy0L2yHvtyaeHbnfgDOvwBHrxAJfwnaebbnrfifHhDYfgasaacH8akY=wiFfYdH8Gipec8Eeeu0xXdbba9frFj0=OqFfea0dXdd9vqai=hGuQ8kuc9pgc9s8qqaq=dirpe0xb9q8qiLsFr0=vr0=vr0dc8meaabaqaciaacaGaaeqabaWaaeGaeaaakeaaimaacqWFneVtaaa@383B@(0, 0.1) and N MathType@MTEF@5@5@+=feaafiart1ev1aaatCvAUfKttLearuWrP9MDH5MBPbIqV92AaeXatLxBI9gBamrtHrhAL1wy0L2yHvtyaeHbnfgDOvwBHrxAJfwnaebbnrfifHhDYfgasaacH8akY=wiFfYdH8Gipec8Eeeu0xXdbba9frFj0=OqFfea0dXdd9vqai=hGuQ8kuc9pgc9s8qqaq=dirpe0xb9q8qiLsFr0=vr0=vr0dc8meaabaqaciaacaGaaeqabaWaaeGaeaaakeaaimaacqWFneVtaaa@383B@(0, 0.2) respectively. The average adjusted Rand index is calculated over 10 simulated datasets for each plot and the range of the adjusted Rand index of each case is shown by error bars.
Figure 4
Figure 4
BIC for PUMA-CLUST and MCLUST. BIC for (a) PUMA-CLUST and (b) MCLUST against the number of mixture components on the 2,461 potential hair growth-associated genes from the mouse time-course dataset. PUMA-CLUST obtains the minimum BIC at K = 22 and MCLUST obtains the minimum at K = 30.
Figure 5
Figure 5
Expression pattern clusters from PUMA-CLUST when K = 22. The clusters are for the 2,461 potential hair cycle-associated genes of the mouse time-course dataset when K = 22. The expression pattern for each probe-set is shown as dark lines for five time points. The light line on each plot is the clustering center for each group. At each time point, the expression value is the average of the three replicated measurements.
Figure 6
Figure 6
Expression pattern clusters from MCLUST when K = 22. The clusters are for the 2,461 potential hair cycle-associated genes of the mouse time-course dataset when K = 22. The expression pattern for each probe-set is shown as dark lines for five time points. The light line on each plot is the clustering center for each group. At each time point, the expression value is the average of the three replicated measurements.
Figure 7
Figure 7
Expression pattern clusters from PUMA-CLUST when K = 30. The clusters are for the 2,461 potential hair-growth-associated genes of the mouse time-course dataset when K = 30. The expression pattern for each probe-set is shown as dark lines for five time points. The light line on each plot is the clustering center for each group. At each time point, the expression value is the average of the three replicated measurements.
Figure 8
Figure 8
Expression pattern clusters from MCLUST when K = 30. The clusters are for the 2,461 potential hair-growth-associated genes of the mouse time-course dataset when K = 30. The expression pattern for each probe-set is shown as dark lines for five time points. The light line on each plot is the clustering center for each group. At each time point, the expression value is the average of the three replicated measurements.
Figure 9
Figure 9
Comparison of the number of clusters found with the indicated ranges of enriched GO categories for MCLUST and PUMA-CLUST clusters. Comparison of the number of clusters found with the indicated ranges of enriched categories for MCLUST and PUMA-CLUST clusters using (a) 22 clusters and (b) 30 clusters. For both comparisons, the enriched categories were found using GO Biological Process term level 5, enrichment cutoff at p-value of 0.05, and mouse (Mus Musculus) as the population background.
Figure 10
Figure 10
Boxplot of the number of enriched categories for MCLUST and PUMA-CLUST clusters. Boxplot of the number of enriched categories for MCLUST and PUMA-CLUST clusters using (a) 22 clusters and (b) 30 clusters. The boxes show the lower quartile, median, and upper quartile values. The dotted lines show the extent of the rest of the data. The number of enriched categories for MCLUST has larger variance than that for PUMA-CLUST.
Figure 11
Figure 11
Comparison of the number of clusters found with the indicated ranges of enriched GO categories for MCLUST and PUMA-CLUST clusters using various probe-level methods. Comparison of the number of clusters found with the indicated ranges of enriched categories for MCLUST and PUMA-CLUST clusters using various probe-level methods when K = 22. For all comparisons, the enriched categories were found using GO Biological Process term level 5, enrichment cutoff at p-value of 0.05, and mouse (Mus Musculus) as the population background.
Figure 12
Figure 12
Boxplot of the number of enriched categories for MCLUST and PUMA-CLUST clusters using various probe-level methods. Boxplot of the number of enriched categories for MCLUST and PUMA-CLUST clusters using various probe-level methods when K = 22. The boxes show the lower quartile, median, and upper quartile values. The dotted lines show the extent of the rest of the data.

References

    1. Schena M, Shalon D, Davis RW, Brown PO. Quantitative monitoring of gene expression patterns with a complementary DNA microarray. Science. 1995;270:467–470. doi: 10.1126/science.270.5235.467. - DOI - PubMed
    1. Lockhart DJ, Dong H, Byrne MC, Follettie MT, Gallo MV, Chee MS, Mittmann M, Wang C, Kobayashi M, Horton H, Brown EL. Expression monitoring by hybridization to high-density oligonucleotide arrays. Nat Biotechnol. 1996;14:1675–1680. doi: 10.1038/nbt1296-1675. - DOI - PubMed
    1. Slonim DK. From pattern to pathways: gene expression data analysis comes of age. Nature Genetics. 2002;32:502–508. doi: 10.1038/ng1033. - DOI - PubMed
    1. Quackenbush J. Computational Analysis of Microarray Data. Nature Reviews Genetics. 2001;2:418–427. doi: 10.1038/35076576. - DOI - PubMed
    1. Eisen MB, Spellman PT, Brown PO, Botstein D. Cluster analysis and display of genome-wide expression patterns. Proc Natl Acad Sci USA. 1998;95:14863–14868. doi: 10.1073/pnas.95.25.14863. - DOI - PMC - PubMed

Publication types