. 2007 May 1;313(8):1615-27.
doi: 10.1016/j.yexcr.2007.02.009. Epub 2007 Feb 22.

Roles of sphingosine-1-phosphate (S1P) receptors in malignant behavior of glioma cells. Differential effects of S1P2 on cell migration and invasiveness

Affiliations

Roles of sphingosine-1-phosphate (S1P) receptors in malignant behavior of glioma cells. Differential effects of S1P2 on cell migration and invasiveness

Nicholas Young et al. Exp Cell Res. .

Abstract

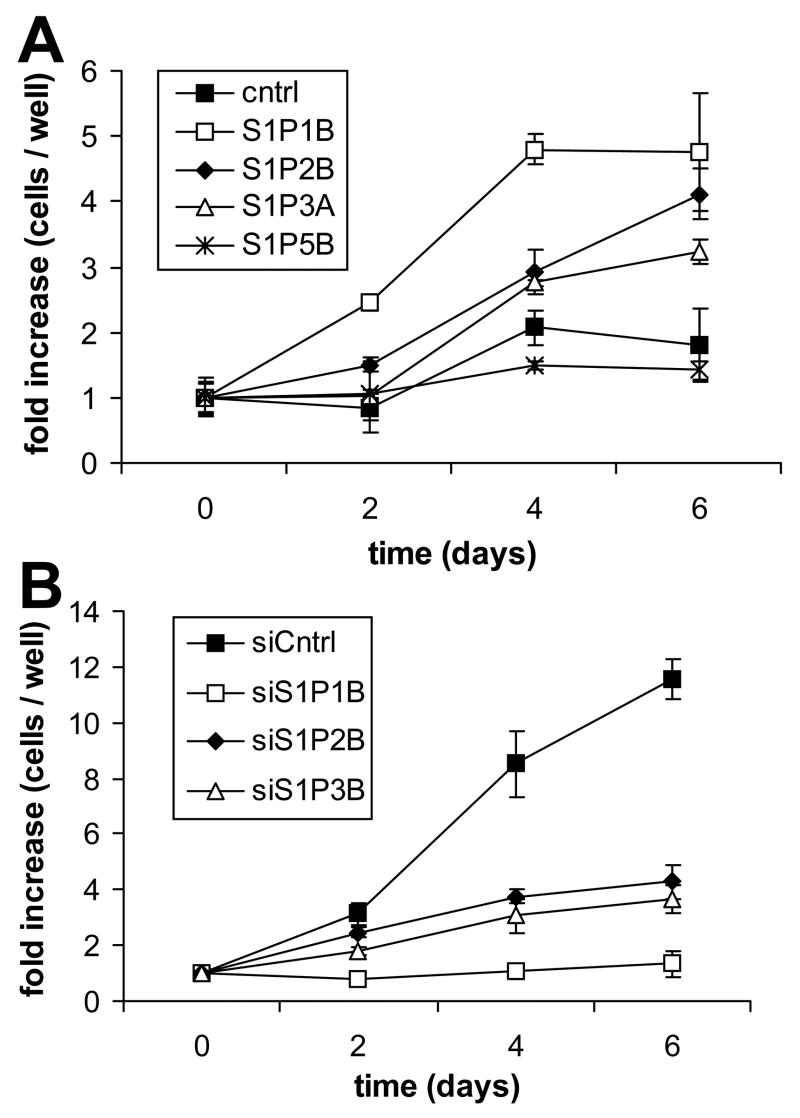
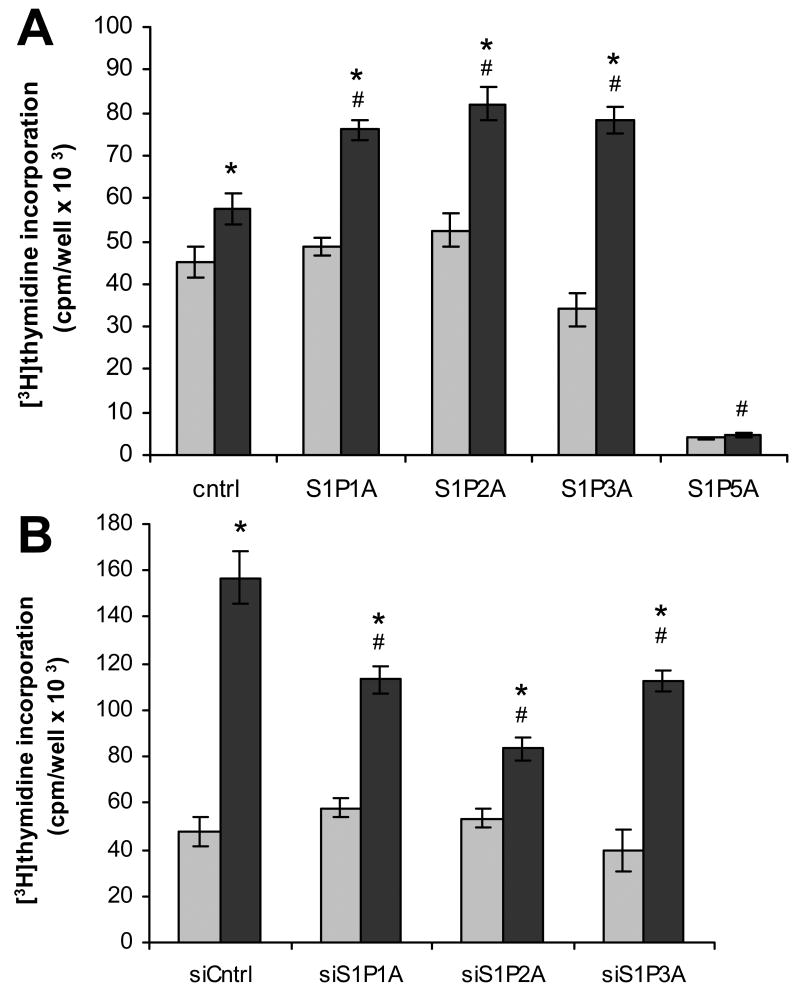
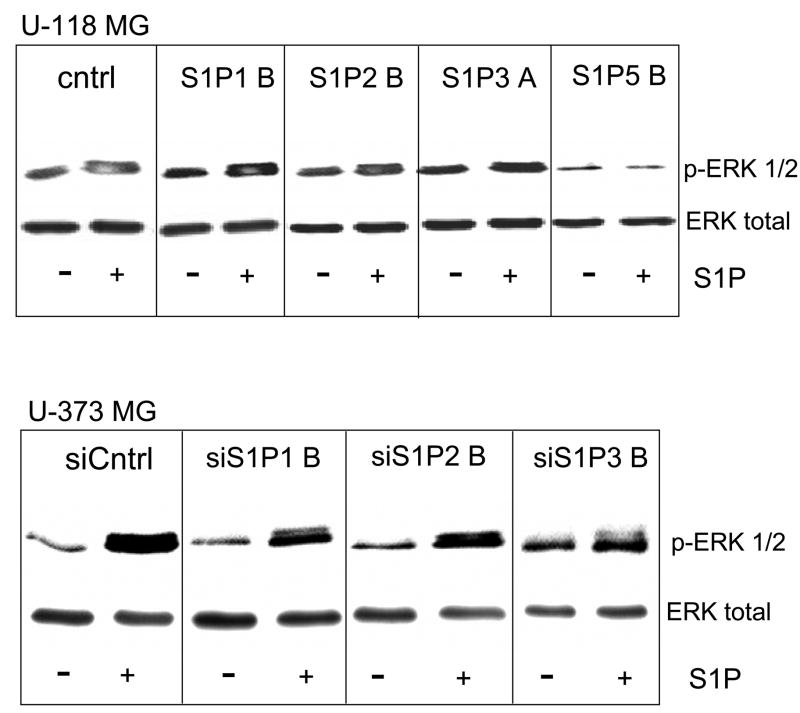
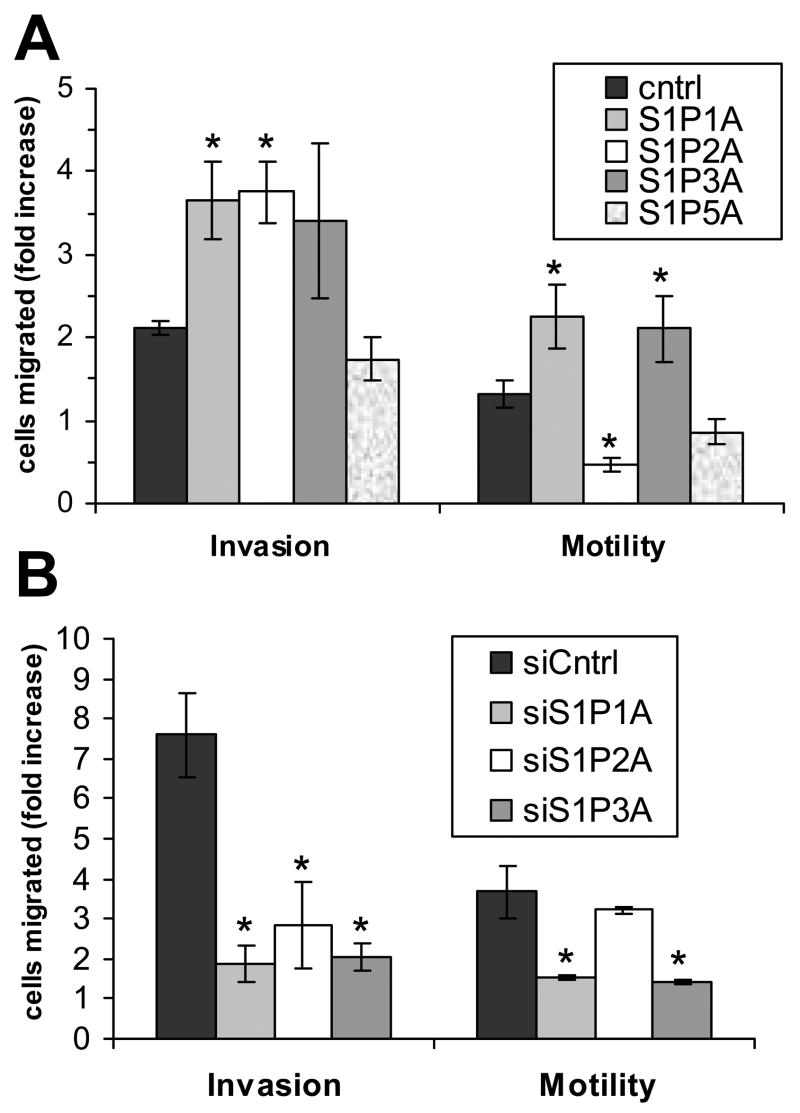
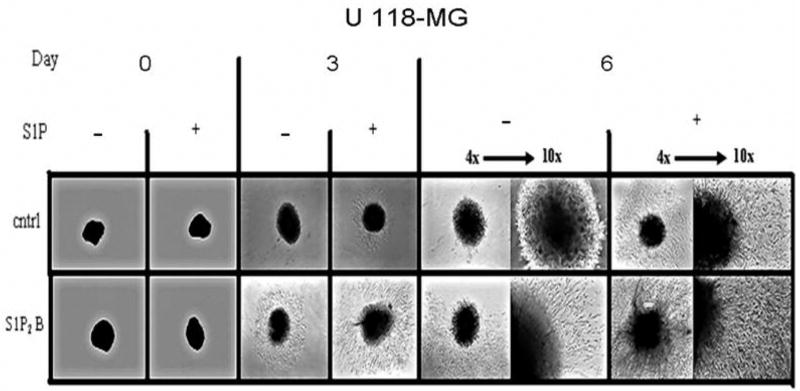
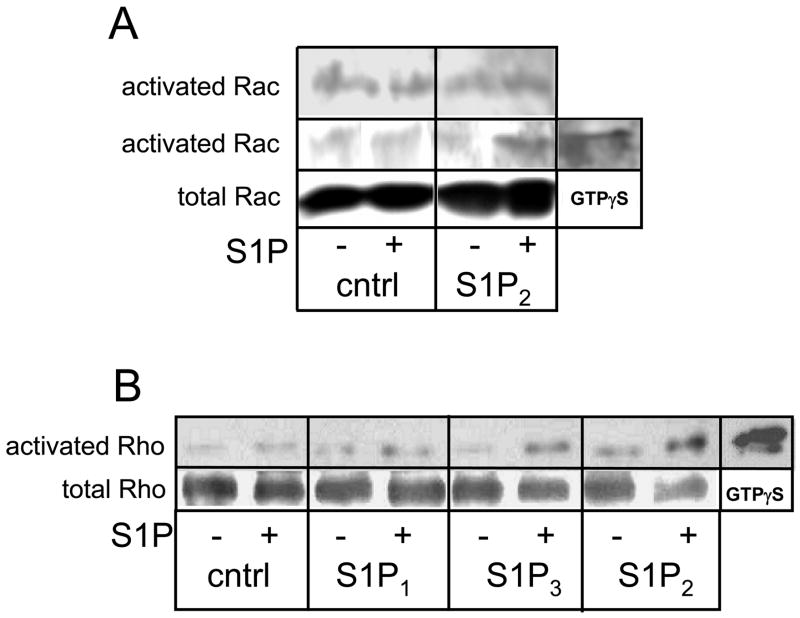
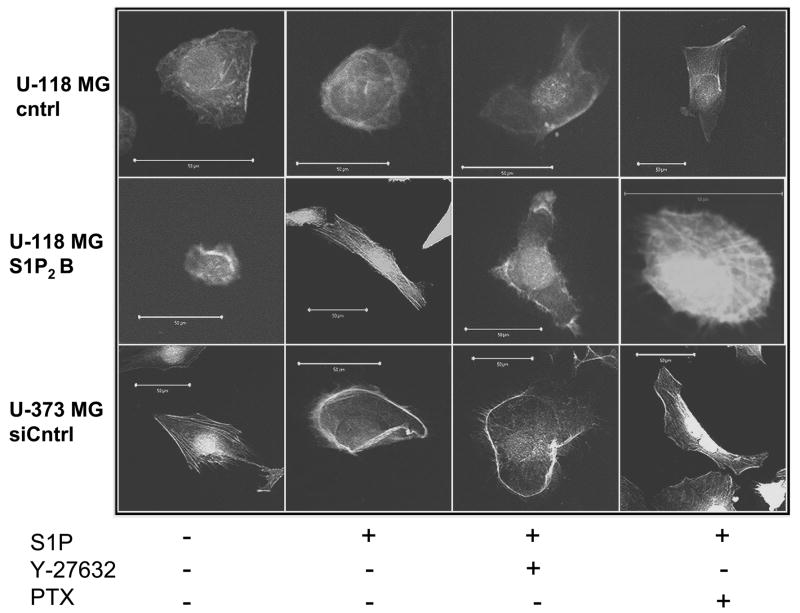
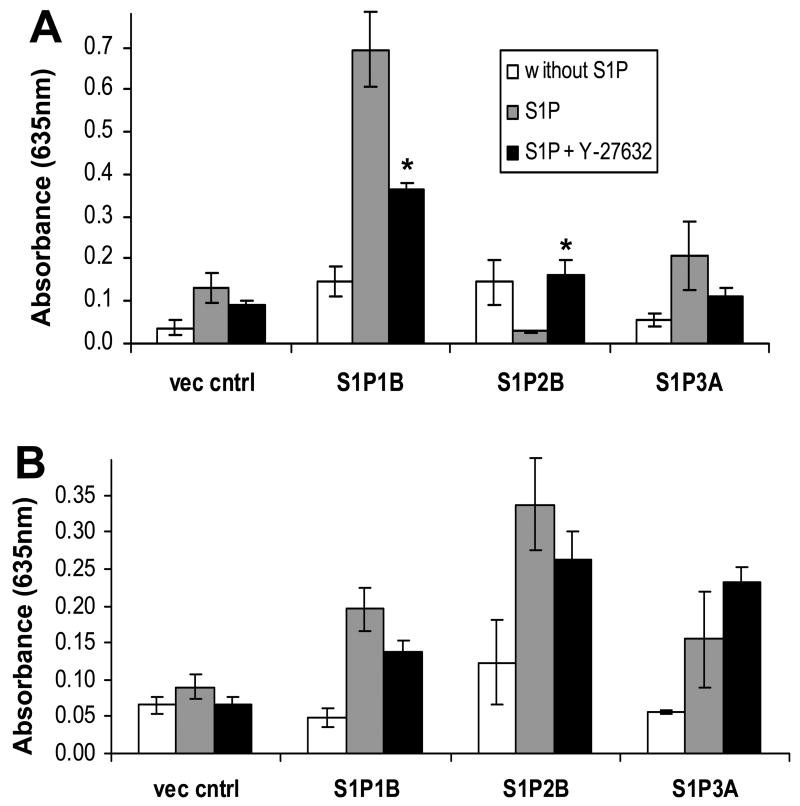
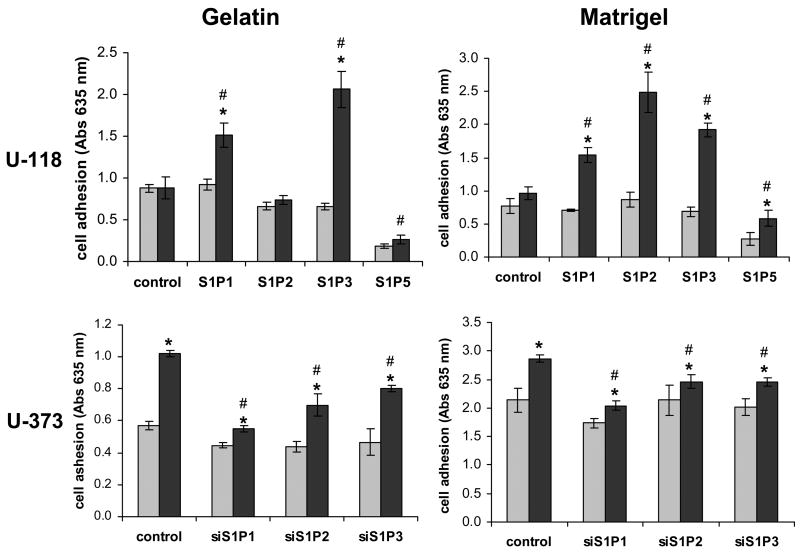
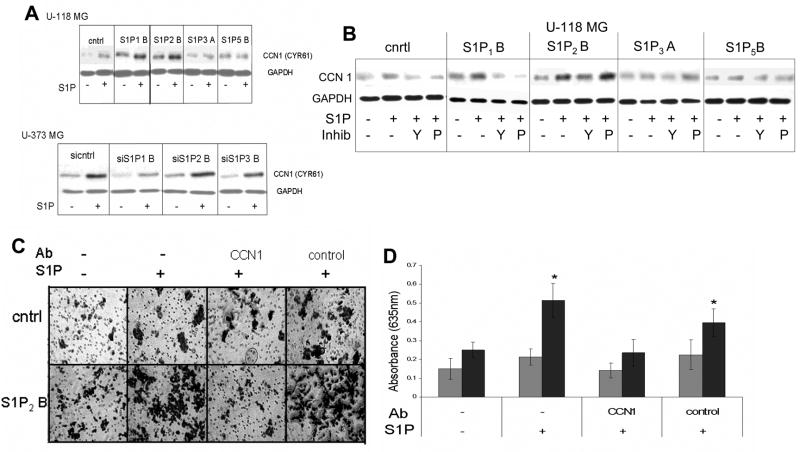
Sphingosine-1-phosphate (S1P) is a bioactive lipid that signals through a family of five G-protein-coupled receptors, termed S1P(1-5). S1P stimulates growth and invasiveness of glioma cells, and high expression levels of the enzyme that forms S1P, sphingosine kinase-1, correlate with short survival of glioma patients. In this study we examined the mechanism of S1P stimulation of glioma cell proliferation and invasion by either overexpressing or knocking down, by RNA interference, S1P receptor expression in glioma cell lines. S1P(1), S1P(2) and S1P(3) all contribute positively to S1P-stimulated glioma cell proliferation, with S1P(1) being the major contributor. Stimulation of glioma cell proliferation by these receptors correlated with activation of ERK MAP kinase. S1P(5) blocks glioma cell proliferation, and inhibits ERK activation. S1P(1) and S1P(3) enhance glioma cell migration and invasion. S1P(2) inhibits migration through Rho activation, Rho kinase signaling and stress fiber formation, but unexpectedly, enhances glioma cell invasiveness by stimulating cell adhesion. S1P(2) also potently enhances expression of the matricellular protein CCN1/Cyr61, which has been implicated in tumor cell adhesion, and invasion as well as tumor angiogenesis. A neutralizing antibody to CCN1 blocked S1P(2)-stimulated glioma invasion. Thus, while S1P(2) decreases glioma cell motility, it may enhance invasion through induction of proteins that modulate glioma cell interaction with the extracellular matrix.


Figures

Fig. 1
Fig. 1
Growth curve analysis of S1P receptor over- and underexpressing glioma cell lines. U-118 MG (A) and U-373 MG (B) cell lines were analyzed for growth in the presence of 100 nM S1P as described in Materials and Methods. Data are expressed as fold increase in cell number over time relative to cells present at Day 0, and are means ± standard deviations of triplicate determinations. Two independent experiments provided similar results. Cell lines of similar levels of receptor over or under expression were used in this experiment.
Fig. 2
Fig. 2
S1P effects on DNA synthesis in S1P receptor over- and underexpressing glioma cell lines. U-118 MG (A) and U-373 MG (B) cell lines were treated with (black bars) and without (gray bars) 100 nM S1P and analyzed for DNA synthesis by [3H]thymidine incorporation as described in Materials and Methods. Data are means ± standard deviations of quadruplicate determinations. Two independent experiments provided similar results. A statistically significant difference (p< 0.05) between S1P-treated and untreated samples for a given cell line is represented with * and a statistically significant difference (p< 0.05) between the S1P-treated control and the S1P-treated receptor over- or underexpressing cell line is represented with #.
Fig. 3
Fig. 3
Erk activation in S1P receptor over- and underexpressing glioma cell lines. U-118 MG and U-373 MG cell lines were treated with or without 100 nM S1P for 10 minutes and ERK activation was measured by Western analysis using a phosphoERK-specific antibody. Blots were stripped of antibodies and reprobed with antibody to ERK2 to show that total ERK2 was present at similar levels in all samples. Two independent experiments provided similar results.
Fig. 4
Fig. 4
Migration and invasion of S1P receptor over- and underexpressing glioma cell lines. U-118 MG (A) and U-373 MG (B) cell lines were analyzed for invasion through Matrigel or migration on gelatin as described in Materials and Methods in the absence and presence of 100 nM S1P. Results are expressed as fold difference in cell movement of S1P-treated cells compared to untreated cells. Data are means ± standard deviations of triplicate determinations. Two independent experiments provided similar results. A statistically significant difference of S1P-treated receptor over- or underexpressing cells relative to control S1P-treated cells (p< 0.05) is represented by *.
Fig. 5
Fig. 5
S1P2 regulation of invasion in a cell spheroid assay. U-118 MG control and S1P2- overexpressing cell spheroids were embedded in Matrigel, and invasion into the surrounding Matrigel was monitored in the absence of presence of 100 nM S1P. Spheroids were photographed every three days using both 4x and 10x objectives of an inverted phase contrast microscope.
Fig. 6
Fig. 6
Regulation of Rac and Rho small GTPases by S1P in over- and underexpressing glioma cell lines. A) Control or S1P2-overexpressing U-118 MG cells were treated without and with 100 nM S1P for 10 minutes. Activated Rac was isolated from cell lysates and subjected to Western analysis as described in Materials and Methods. Results of two independent experiments are shown. Total rac from whole cell lysates was blotted as a loading control. B) Control or S1P receptor-overexpressing U-118 MG cells were treated without and with 100 nM S1P for 10 minutes. Activated Rho was isolated from cell lysates and subjected to Western analysis as described in Materials and Methods. Two independent experiments provided similar results. Positive control samples for activated Rac or Rho were generated by adding the non-hydrolyzable GTP analog GTPγS to separate lysates.
Fig. 7
Fig. 7
Effect of S1P on the actin cytoskeleton. U-118-control or S1P2-overexpressing cells or U-373-siControl cells were pretreated with or without 10 μM Y-27632 for 30 minutes or with 200 ng/ml PTX for 3 hours and then treated with or withour 100 nM S1P for 3 hours. Cells were stained with TRITC-labeled phalloidin and visualized by confocal microscopy as described in Materials and Methods. Photographs of representative cells are shown. Scale bars indicate 50 μm.
Fig 8
Fig 8
Role of Rho kinase in S1P-stimulated motility and invasiveness. U-118-control or S1P receptor overexpressing cells were pretreated with or without Y-27632 for 30 minutes and then examined for S1P regulation of cell motility and invasiveness as described for Figure 4. Results are means ± standard deviations of triplicte determinations. The * indicates a statistically significant difference (p < 0.05) for S1P + Y-27632 compared to S1P alone for a given cell line.
Fig. 9
Fig. 9
Regulation of adhesion by S1P receptors. Serum-starved cells were treated with 100 nM S1P (black bars) or without S1P (gray bars) and adhesion to wells coated with either gelatin or Matrigel was measured as described in Materials and Methods (A). Data are means ± standard deviations of triplicate determinations. Two independent experiments provided similar results. The * represent a statistically significant difference (p< 0.05) between S1P-treated and untreated samples. The # represent a statistically significant difference (p< 0.05) between the S1P-treated control and the S1P-treated receptor overexpresser or underexpresser cell line.
Fig. 10
Fig. 10
Role of CCN1/Cyr61 in S1P2-stimulated glioma cell invasion. (A) U-373 MG and U-118 MG cells were stimulated with or without S1P for 3 hours. (B) Cells were pretreated with or without 10 μM Y-27632 for 30 minutes (Y) or with 200 ng/ml PTX (P) for 3 hours and then treated with or withour 100 nM S1P for 3 hours. For both panels A and B cell lysates were subjected to western blot analysis for CCN1. Blots were stripped of antibodies and reprobed for GAPDH as a loading control. (C) S1P-stimulated invasion of U-118 MG control and S1P2-overexpressing cells was analyzed using the transwell assay in the absence and presence of antibodies to CCN1 or an irrelevant control antibody (anti-pAKT). (D) Results from the experiment shown in Panel C were quantitated as described in Materials and Methods. Gray bars represent U-118 MG control cells. Black bars represent S1P2-overexpressing cells. The * indicates a statistically significant difference (p< 0.05) between S1P-treated and untreated cells of the same cell line.

Similar articles

Cited by

References

    1. Spiegel S, Milstien S. Sphingosine-1-phosphate: an enigmatic signalling lipid. Nat Rev Mol Cell Biol. 2003;4:397–407. - PubMed
    1. Hla T. Physiological and pathological actions of sphingosine 1-phosphate. Semin Cell Dev Biol. 2004;15:513–520. - PubMed
    1. Young N, Van Brocklyn JR. Signal transduction of sphingosine-1-phosphate G protein-coupled receptors. TheScientificWorldJOURNAL. 2006;6:946–66. doi: 10.1100/tsw.2006.182. - DOI - PMC - PubMed
    1. Spiegel S, Milstien S. Exogenous and intracellularly generated sphingosine 1-phosphate can regulate cellular processes by divergent pathways. Biochem Soc Trans. 2003;31:1216–1219. - PubMed
    1. Lefranc F, Sadeghi N, Camby I, Metens T, Dewitte O, Kiss R. Present and potential future issues in glioblastoma treatment. Expert Rev Anticancer Ther. 2006;6:719–732. - PubMed

Publication types

MeSH terms

Substances