Comparative Study
. 2007 Mar 21;27(12):3120-30.
doi: 10.1523/JNEUROSCI.0054-07.2007.

Fragile X mental retardation protein induces synapse loss through acute postsynaptic translational regulation

Affiliations
Comparative Study

Fragile X mental retardation protein induces synapse loss through acute postsynaptic translational regulation

Brad E Pfeiffer et al. J Neurosci. .

Abstract

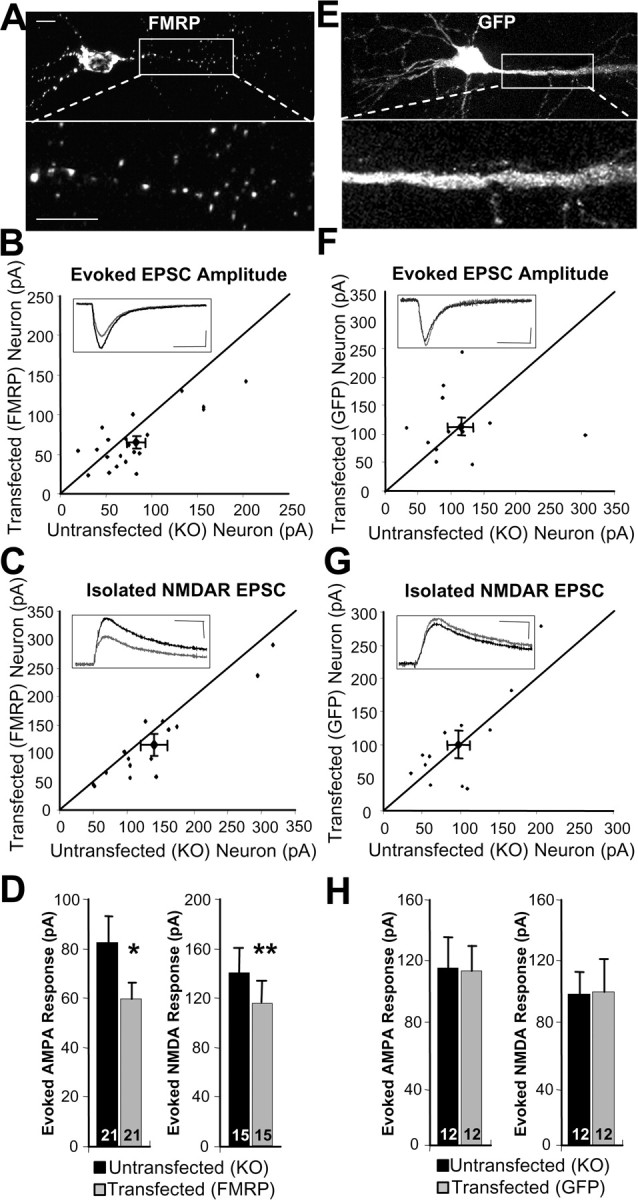
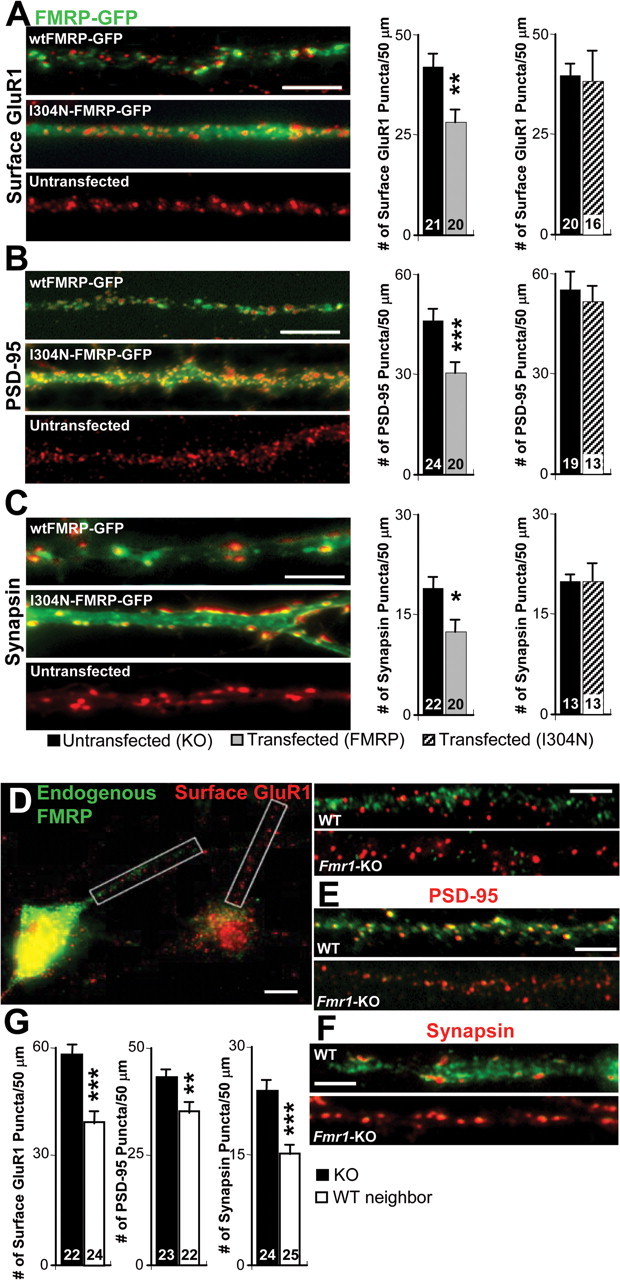
Fragile X syndrome, as well as other forms of mental retardation and autism, is associated with altered dendritic spine number and structure. Fragile X syndrome is caused by loss-of-function mutations in Fragile X mental retardation protein (FMRP), an RNA-binding protein that regulates protein synthesis in vivo. It is unknown whether FMRP plays a direct, cell-autonomous role in regulation of synapse number, function, or maturation. Here, we report that acute postsynaptic expression of FMRP in Fmr1 knock-out (KO) neurons results in a decrease in the number of functional and structural synapses without an effect on their synaptic strength or maturational state. Similarly, neurons endogenously expressing FMRP (wild-type) have fewer synapses than neighboring Fmr1 KO neurons. An intact K homology domain 2 (KH2) RNA-binding domain and dephosphorylation of FMRP at S500 were required for the effects of FMRP on synapse number, indicating that FMRP interaction with RNA and translating polyribosomes leads to synapse loss.


Figures

Figure 1.
Figure 1.
Acute postsynaptic FMRP expression reduces evoked AMPAR and NMDAR mediated EPSCs. A, Expression pattern of FMRP-GFP fusion protein in a CA1 pyramidal neuron in hippocampal slice culture. Scale bars, 10 μm. B, C, Dot plot of the peak amplitude of the evoked AMPAR- (B) or NMDAR-mediated EPSCs (C) of paired recordings from an untransfected Fmr1 KO versus a neighboring FMRP transfected neuron. In this and all figures, the diagonal line represents the values where the EPSC amplitudes from transfected and untransfected cells are equal. The large diamond represents mean ± SEM. Inset, Average of 25 consecutive traces from a representative experiment. Black trace is the untransfected neuron, gray trace is the transfected neuron. Scale bar is 20 pA and 20 ms. Stimulation artifact has been digitally removed for clarity. D, Average AMPAR and NMDAR EPSC amplitude from untransfected KO and FMRP transfected cells. E, As in A, but image shows GFP expression pattern. F, G, As in B and C, but dot plots represent peak evoked AMPAR-mediated (F) and NMDAR-mediated (G) EPSCs from neighboring untransfected and GFP-expressing Fmr1 KO neurons. H, Average AMPAR and NMDAR EPSC amplitude from untransfected KO and GFP transfected cells. In this and all figures, averages are plotted + SEM and n is plotted on each bar. *p < 0.05; **p < 0.01.
Figure 2.
Figure 2.
Postsynaptic FMRP reduces the frequency, but not amplitude of miniature EPSCs. A, Representative traces of mEPSCs simultaneously recorded from an untransfected Fmr1 KO and a neighboring FMRP transfected neuron. Calibration: 10 pA, 500 ms. B, C, Dot plot representation of the frequency (B) and amplitude (C) of mEPSCs in paired recordings. Inset, Cumulative probability distributions for both untransfected neurons (solid black line) and transfected, FMRP-expressing neurons (dotted line). Each point on the curve represents the average mEPSC frequency and amplitude from an individual neuron. The x-axis is the mEPSC frequency (B) or amplitude (C). The y-axis is the cumulative probability. D, Average mEPSC frequency and amplitude in untransfected KO and FMRP transfected cells. E, Representative traces from untransfected and neighboring GFP-expressing Fmr1 KO neurons. Calibration: 20 pA, 500 ms. F, G, Dot plots of mEPSC frequency (F) and amplitude (G) from neighboring untransfected and GFP-expressing Fmr1 KO CA1 pyramidal neurons. Inset, Cumulative probability distribution for both untransfected neurons (solid black line) and transfected, GFP-expressing neurons (dotted line). H, Average mEPSC frequency and amplitude in untransfected KO and GFP transfected cells. **p < 0.01.
Figure 3.
Figure 3.
Postsynaptic FMRP increases synaptic failures, but does not affect paired-pulse facilitation or silent synapses. A, Representative experiment. Raw, Average of 25 consecutive traces simultaneously recorded from an untransfected Fmr1 KO and a neighboring FMRP transfected neuron. Calibration: 20 pA, 20 ms. Scaled, Traces from Raw have been scaled so that the S1 EPSC amplitude of the transfected neuron is equal to that of the untransfected neuron. B, Paired-pulse facilitation values (mean ± SEM) at a range of interstimulus intervals is not different between FMRP transfected and untransfected KO neurons as determined with a repeated measures ANOVA (F(1,30) = 0.642; p = 0.42). C, Dot plot representation of the peak amplitude of the first response (S1) in paired recordings from an untransfected Fmr1 KO neuron and FMRP-transfected neuron (n = 18). D, Average EPSC amplitude for S1. E, Representative minimal stimulation experiment. Evoked responses were obtained in simultaneous recordings from an untransfected Fmr1 KO neuron and FMRP transfected neuron using minimal stimulation. Shown are 25 consecutive traces separated into failures and successes for an FMRP-transfected and untransfected neuron held at −60 mV (left) and +50 mV (right) and an average of the successes. Calibration: 20 pA, 10 ms. F, Average percentage of synaptic failures at −60 mV and +50 mV, the peak amplitude of synaptic successes at −60 mV (synaptic potency), and the percentage of silent synapses in FMRP transfected and untransfected neurons. *p < 0.05; **p < 0.01.
Figure 4.
Figure 4.
Acute exogenous and endogenous FMRP reduce the number of synapses as measured with immunocytochemical markers. A, Left, Representative dendrites of Fmr1 KO dissociated hippocampal cultures transfected with either wtFMRP-GFP or I304N-FMRP-GFP (green) and labeled for surface GluR1 (red). Right, Average number of surface GluR1 puncta in neurons transfected with either wtFMRP-GFP or I304N-FMRP-GFP and neighboring untransfected KO neurons. B, Left, As in A, except red is PSD-95 immunofluorescence. Right, Average number of PSD-95 puncta. C, Left, As in A, except red is synapsin immunofluorescence. Right, Average number of synapsin puncta. D, Left, Representative image of side-by-side wild-type and Fmr1 KO neurons in culture. Green is endogenous FMRP immunofluorescence. Red is surface GluR1 immunofluorescence. Right, Dendrites of the wild-type and Fmr1 KO neuron. E, As in A, except red is PSD-95 immunofluorescence. F, As A, except red is synapsin immunofluorescence. G, Average number of surface GluR1, PSD-95, and synapsin puncta in wild-type neurons and neighboring Fmr1 KO neurons. *p < 0.05; **p < 0.01; ***p < 0.001. Scale bars: A–C, 10 μm; D, left, 10 μm; D, right, 5 μm; E, F, 10 μm
Figure 5.
Figure 5.
An intact KH2 RNA-binding domain of FMRP, but not an RGG box, is required to reduce synapse function. A, Expression pattern of I304N-FMRP-GFP fusion protein in a CA1 pyramidal neuron in slice culture. B, Dot plot of the peak amplitude of the evoked AMPAR-EPSCs from paired recordings of untransfected Fmr1 KO versus I304N-FMRP transfected neurons. Inset, Representative evoked EPSCs from one neuron pair. C, Representative traces of mEPSCs simultaneously recorded from an untransfected Fmr1 KO and I304N-FMRP transfected neuron. D, E, Dot plot representation of the frequency (D) and amplitude (E) of mEPSCs in Fmr1 KO versus neighboring I304N-FMRP transfected neurons. Inset, Cumulative probability distribution of mEPSC frequency and amplitude for both untransfected neurons (solid black line) and transfected I304N-FMRP-expressing neurons (dotted line). F, Group data (mean + SEM) of B, D, and E. G–L, As in A–F, except the transfected neurons express ΔRGG-FMRP-GFP. *p < 0.05. Scale bars: A, G, 10 μm. Calibrations: B, H, insets, 20 pA, 20 ms; C, I, 10 pA, 500 ms.
Figure 6.
Figure 6.
Dephosphorylated FMRP reduces synapse function and number. A, Expression pattern of S500A-FMRP-GFP in CA1 pyramidal neuron in hippocampal slice cultures. B, Dot plot of the peak amplitude of the evoked EPSC of paired recordings from untransfected Fmr1 KO and neighboring S500A-FMRP transfected neuron. C, Representative traces of mEPSCs simultaneously recorded from untransfected Fmr1 KO and S500A-FMRP transfected neuron. D, E, Dot plot of the frequency (D) and amplitude (E) of mEPSCs from untransfected Fmr1 KO versus neighboring S500A-FMRP-transfected neurons. Insets, Cumulative probability distribution for both untransfected neurons (solid black line) and transfected S500A-FMRP-expressing neurons (dotted line). F, Group data (mean + SEM) of B, D, and E. G–L, As in A–F, except the transfected neurons express S500D-FMRP-GFP. M, Left, Dendrites of Fmr1 KO dissociated hippocampal cultures transfected with either S500A-FMRP-GFP or S500D-FMRP-GFP (green) and immunofluorescence for PSD-95 (red). Right, Average number of PSD-95 puncta in neurons transfected with either S500A-FMRP-GFP or S500D-FMRP-GFP and neighboring untransfected neurons. N, As in A, except red is synapsin immunofluorescence. On the right is the average number of synapsin puncta. *p < 0.05; **p < 0.01. Scale bars: A, G, N, 10 μm; M, 5 μm. Calibrations: B, inset, 50 pA, 20 ms; C, I, 20 pA, 500 ms; H, inset, 25 pA, 20 ms

References

    1. Antar LN, Afroz R, Dictenberg JB, Carroll RC, Bassell GJ. Metabotropic glutamate receptor activation regulates fragile X mental retardation protein and Fmr1 mRNA localization differentially in dendrites and at synapses. J Neurosci. 2004;24:2648–2655. - PMC - PubMed
    1. Antar LN, Dictenberg JB, Plociniak M, Afroz R, Bassell GJ. Localization of FMRP-associated mRNA granules and requirement of microtubules for activity-dependent trafficking in hippocampal neurons. Genes Brain Behav. 2005;4:350–359. - PubMed
    1. Antar LN, Li C, Zhang H, Carroll RC, Bassell GJ. Local functions for FMRP in axon growth cone motility and activity-dependent regulation of filopodia and spine synapses. Mol Cell Neurosci. 2006 - PubMed
    1. Bagni C, Greenough WT. From mRNP trafficking to spine dysmorphogenesis: the roots of fragile X syndrome. Nat Rev Neurosci. 2005;6:376–387. - PubMed
    1. Braun K, Segal M. FMRP involvement in formation of synapses among cultured hippocampal neurons. Cereb Cortex. 2000;10:1045–1052. - PubMed

Publication types

MeSH terms