

Rapid and intermittent cotransport of slow component-b proteins
- PMID: 17376974
- PMCID: PMC6672457
- DOI: 10.1523/JNEUROSCI.4999-06.2007
Rapid and intermittent cotransport of slow component-b proteins
Abstract
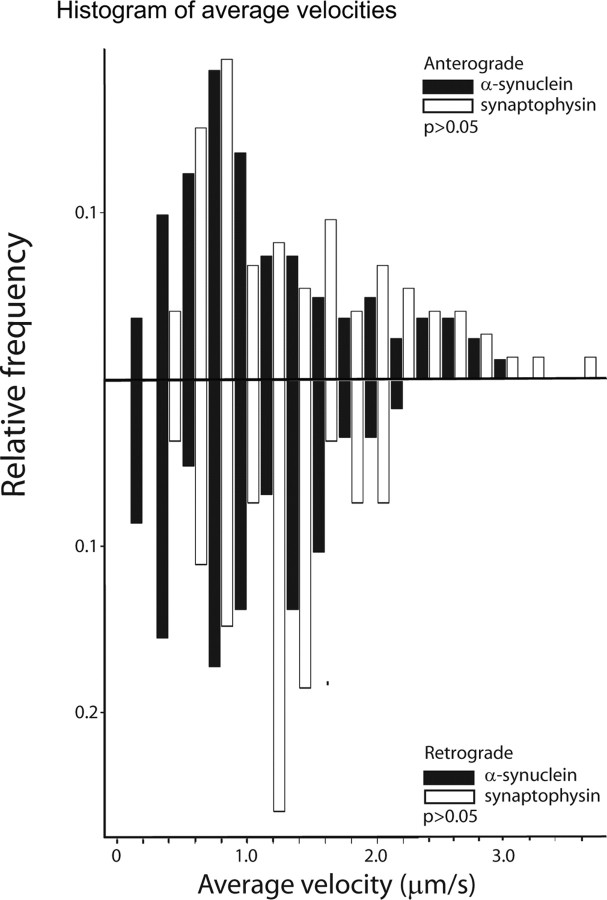
After synthesis in neuronal perikarya, proteins destined for synapses and other distant axonal sites are transported in three major groups that differ in average velocity and protein composition: fast component (FC), slow component-a (SCa), and slow component-b (SCb). The FC transports mainly vesicular cargoes at average rates of approximately 200-400 mm/d. SCa transports microtubules and neurofilaments at average rates of approximately 0.2-1 mm/d, whereas SCb translocates approximately 200 diverse proteins critical for axonal growth, regeneration, and synaptic function at average rates of approximately 2-8 mm/d. Several neurodegenerative diseases are characterized by abnormalities in one or more SCb proteins, but little is known about mechanisms underlying SCb compared with FC and SCa. Here, we use live-cell imaging to visualize and quantify the axonal transport of three SCb proteins, alpha-synuclein, synapsin-I, and glyceraldehyde-3-phosphate dehydrogenase in cultured hippocampal neurons, and directly compare their transport to synaptophysin, a prototypical FC protein. All three SCb proteins move rapidly but infrequently with pauses during transit, unlike synaptophysin, which moves much more frequently and persistently. By simultaneously visualizing the transport of proteins at high temporal and spatial resolution, we show that the dynamics of alpha-synuclein transport are distinct from those of synaptophysin but similar to other SCb proteins. Our observations of the cotransport of multiple SCb proteins in single axons suggest that they move as multiprotein complexes. These studies offer novel mechanistic insights into SCb and provide tools for further investigating its role in disease processes.
Figures


Similar articles
-
Cytoskeletal requirements in axonal transport of slow component-b.J Neurosci. 2008 May 14;28(20):5248-56. doi: 10.1523/JNEUROSCI.0309-08.2008. J Neurosci. 2008. PMID: 18480281 Free PMC article.
-
The slow axonal transport of alpha-synuclein--mechanistic commonalities amongst diverse cytosolic cargoes.Cytoskeleton (Hoboken). 2012 Jul;69(7):506-13. doi: 10.1002/cm.21019. Epub 2012 Mar 2. Cytoskeleton (Hoboken). 2012. PMID: 22344896 Free PMC article.
-
Diversity in the axonal transport of structural proteins: major differences between optic and spinal axons in the rat.J Neurosci. 1986 Jun;6(6):1593-605. doi: 10.1523/JNEUROSCI.06-06-01593.1986. J Neurosci. 1986. PMID: 2423662 Free PMC article.
-
Axonal transport: The orderly motion of axonal structures.Methods Cell Biol. 2016;131:1-19. doi: 10.1016/bs.mcb.2015.06.001. Epub 2015 Sep 2. Methods Cell Biol. 2016. PMID: 26794507 Review.
-
Seeing the unseen: the hidden world of slow axonal transport.Neuroscientist. 2014 Feb;20(1):71-81. doi: 10.1177/1073858413498306. Epub 2013 Aug 2. Neuroscientist. 2014. PMID: 23912032 Free PMC article. Review.
Cited by
-
Pathologic modifications of alpha-synuclein in 1-methyl-4-phenyl-1,2,3,6-tetrahydropyridine (MPTP)-treated squirrel monkeys.J Neuropathol Exp Neurol. 2008 Aug;67(8):793-802. doi: 10.1097/NEN.0b013e318180f0bd. J Neuropathol Exp Neurol. 2008. PMID: 18648323 Free PMC article.
-
Redistribution of DAT/α-synuclein complexes visualized by "in situ" proximity ligation assay in transgenic mice modelling early Parkinson's disease.PLoS One. 2011;6(12):e27959. doi: 10.1371/journal.pone.0027959. Epub 2011 Dec 7. PLoS One. 2011. PMID: 22163275 Free PMC article.
-
Inhibition of LRRK2 kinase activity promotes anterograde axonal transport and presynaptic targeting of α-synuclein.Acta Neuropathol Commun. 2021 Nov 8;9(1):180. doi: 10.1186/s40478-021-01283-7. Acta Neuropathol Commun. 2021. PMID: 34749824 Free PMC article.
-
Protein aggregate spreading in neurodegenerative diseases: problems and perspectives.Neurosci Res. 2011 Aug;70(4):339-48. doi: 10.1016/j.neures.2011.05.008. Epub 2011 May 20. Neurosci Res. 2011. PMID: 21624403 Free PMC article. Review.
-
Neuronal Soma-Derived Degradative Lysosomes Are Continuously Delivered to Distal Axons to Maintain Local Degradation Capacity.Cell Rep. 2019 Jul 2;28(1):51-64.e4. doi: 10.1016/j.celrep.2019.06.013. Cell Rep. 2019. PMID: 31269450 Free PMC article.
References
-
- Ahmari SE, Buchanan J, Smith SJ. Assembly of presynaptic active zones from cytoplasmic transport packets. Nat Neurosci. 2000;3:445–451. - PubMed
-
- Almenar-Queralt A, Goldstein LS. Linkers, packages and pathways: new concepts in axonal transport. Curr Opin Neurobiol. 2001;11:550–557. - PubMed
-
- Baas PW, Buster DW. Slow axonal transport and the genesis of neuronal morphology. J Neurobiol. 2004;58:3–17. - PubMed
Publication types
MeSH terms
Substances
Grants and funding
LinkOut - more resources
Full Text Sources
Research Materials