Comparative Study
. 2007 Mar 21;27(12):3174-86.
doi: 10.1523/JNEUROSCI.3965-06.2007.

Thyroid hormone deficiency affects postnatal spiking activity and expression of Ca2+ and K+ channels in rodent inner hair cells

Affiliations
Comparative Study

Thyroid hormone deficiency affects postnatal spiking activity and expression of Ca2+ and K+ channels in rodent inner hair cells

Niels Brandt et al. J Neurosci. .

Abstract

Thyroid hormone (TH) is essential for the development of hearing. Lack of TH in a critical developmental period from embryonic day 17 to postnatal day 12 (P12) in rats and mice leads to morphological and functional deficits in the organ of Corti and the auditory pathway. We investigated the effects of TH on inner hair cells (IHCs) using patch-clamp recordings, capacitance measurements, and immunocytochemistry in hypothyroid rats and athyroid Pax8-/- mice. Spontaneous and evoked Ca2+ action potentials (APs) were present in control IHCs from P3-P11 rats and vanished in parallel with the expression of a rapidly activating Ca2+- and voltage-activated K+ (BK) conductance. IHCs of hypothyroid rats and athyroid Pax8-/- mice displayed APs until the end of the third postnatal week because of threefold elevated Ca2+ currents and missing expression of BK currents. After the fourth postnatal week, some IHCs showed BK currents whereas adjacent IHCs did not, demonstrated by electrophysiology and immunocytochemistry. To test whether the prolonged spiking activity during TH deficiency may be transmitted at IHC synapses, capacitance measurements were performed in parallel to analysis of otoferlin expression, a protein thought to play an essential role in exocytosis of IHCs. Strikingly, otoferlin was absent from IHCs of hypothyroid rats but not of Pax8-/- mice, although both cell types showed exocytosis with an efficiency typical for immature IHCs. These results demonstrate for the first time a TH-dependent control of IHC spiking activity before the onset of hearing attributable to effects of TH on Ca2+ and BK channels. Moreover, they question an indispensable role of otoferlin for exocytosis in IHCs.


Figures
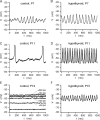
Figure 1.
Figure 1.
Postnatal IHCs of euthyroid and hypothyroid rats generate spontaneous Ca2+ action potentials. Membrane potentials of IHCs were recorded in the current-clamp mode (I = 0) of the whole-cell patch-clamp configuration. A, B, Spontaneous action potentials in P7 IHCs of control rats (A) were similar to those of hypothyroid rats (B). C, D, At P11, a control rat IHC generated APs at low frequencies (2 Hz, C) whereas, in contrast, a hypothyroid IHC showed spontaneous APs at a much higher rate (21 Hz, D). E, A control IHC did not show spontaneous spiking activity at P13 (lowermost trace) and current injections of 50–200 pA shifted the membrane potential in the positive direction (size of injected currents indicated at the traces) rather than triggering action potentials. F, High-frequency spontaneous voltage oscillations (APs) persisted in an IHC of a hypothyroid rat at P15.
Figure 2.
Figure 2.
Spontaneous and induced spiking activity persist in IHCs of hypothyroid rats beyond P12. Electrically silent IHCs of both control and hypothyroid rats could be turned into electrically active cells by injecting small currents as shown for a hypothyroid IHC at P19 (A–D). A, No spontaneous action potentials were present at a resting membrane potential of about −67 mV. B–D, Ca2+ action potentials with increasing frequencies could be evoked by injections of small currents (2–20 pA as indicated at the traces). E, Percentage of spontaneously active IHCs as a function of age for control and hypothyroid rats and logistic fits (solid line, control; dashed line, hypothyroid). F, Percentage of electrically active IHCs as a function of age for control and hypothyroid animals and logistic fits (solid line, control; dashed line, hypothyroid). By injecting small currents, APs could be elicited in IHCs previously judged “electrically silent.” Note that IHCs of control rats did not spike after P12, regardless of current injection (compare Fig. 1E). Numbers of IHCs in E, F: control, P2, 5; P7, 5; P9, 7; P11, 6; P13, 5; P16, 2; P20, 2; P26, 4; P30, 4; hypothyroid, P3, 6; P5, 6; P8, 8; P12, 2; P15, 8; P18, 2; P19, 1; P23, 2; P27, 3; P31, 3; P32, 3. G, Average maximum frequencies for evoked APs in IHCs of hypothyroid and euthyroid rats as a function of age. Maximum spiking frequencies nearly doubled in hypothyroid IHCs at P12 or later compared with P8 hypothyroid or P7–P11 euthyroid (control) IHCs. IHC numbers: control, P7, 3; P9, 7; P11, 3; hypothyroid, P3, 2; P5, 1; P8, 5; P12, 2; P15, 6; P18, 3. H, Dependence of the spontaneous frequency of Ca2+ APs on the membrane potential in control and hypothyroid IHCs. I, Frequency-to-voltage curves for three typical control IHCs (filled symbols and asterisks) and hypothyroid IHCs (unfilled symbols) after current injection. Symbols and current sizes: asterisk, control, P7, from −54 to −45 pA; filled circle, control, P9, from −4 to 100 pA; filled triangle, control, P11, from 0 to 50 pA; unfilled rectangle, hypothyroid, P8, from −25 to 0 pA; unfilled circle, hypothyroid, P12, from −16 to 10 pA; unfilled triangle, hypothyroid, P19, from 2 to 35 pA. K, Membrane potential values of rat IHCs and fits by a four-parameter logistic function of postnatal age with equal asymptotes and slopes and different times of half-maximal shifts for control (solid line) and hypothyroid rats (dashed line). The gray bars in EG and K indicate the approximate age of the onset of hearing in control animals.
Figure 3.
Figure 3.
Ca2+ channel currents (charge carrier, 10 mm Ba2+; IBa) in IHCs of hypothyroid rats showed a larger developmental IBa maximum and a delayed reduction of IBa to the mature levels of control IHCs. A, B, Selected IBa inward-current traces in response to step depolarizations for 8 ms of an IHC of a control rat (A) and of a hypothyroid rat (B) at P9, respectively. Command potentials are given at the traces, the holding potential was −70 mV (A) and −68 mV (B). C, Corresponding current-voltage relations for the IHCs of the control and the hypothyroid rat were determined by averaging the current responses during the last millisecond of the voltage steps, respectively. D, Peak IBa amplitudes were averaged for control and hypothyroid IHCs and plotted as a function of age. IHC IBa amplitudes of euthyroid controls showed a developmental maximum around P9 to P12 and a decline at ages older than P12 to values as low as in neonatals. Average IBa amplitudes in IHCs of hypothyroid rats showed a delayed maximum around P19 that was twice as large as in the control IHCs. n values: control IHCs, P1, 1; P3, 2; P5, 14; P9, 3; P12, 7; P15, 13; P17, 10; P19, 3; P30, 6; hypothyroid, P3, 2; P10, 7; P15, 2; P19, 6; P25, 4; P32, 2. The gray bar in D indicates the approximate age of the onset of hearing in control animals.
Figure 4.
Figure 4.
Peak K+ current amplitudes remain smaller in IHCs of hypothyroid rats compared with controls until at least P32. A–E, Whole-cell outward currents in postnatal IHCs of control and hypothyroid rats. A, B, Outward K+ currents in neonatal IHCs (P2) of a control rat (A) and a hypothyroid rat (B) in response to 10 mV depolarization steps for 200 ms looked very similar. The holding potential and the maximum potential achieved are indicated below and above the traces, respectively. C, Peak K+ currents in a P19 control IHC increased by a factor of six during maturation and current activation became faster. D, Outward currents in a P19 IHC of a hypothyroid animal were much smaller than in the P19 control IHC (C) and showed the same slow K+-current activation kinetics as in the control and hypothyroid IHCs at P2 (A, B). E, In a P32 hypothyroid IHC, K+ currents had further increased and showed faster activation kinetics compared with the hypothyroid IHC at P19 (D), but had not yet reached the amplitude and the fast kinetics of the K+ currents of the P19 control IHC (C). F, Peak I–Vs of the whole-cell currents shown in AE. K+ currents of P19 control IHCs were activating more negatively than P2 control IHCs and hypothyroid IHCs of every age. G, Peak K+ current amplitudes at 0 mV of 39 control and 40 hypothyroid IHCs as a function of age and four-parameter logistic regressions (solid line, control; dashed line, hypothyroid) applied to logarithms of K+ currents with differences between hypothyroids and controls in every parameter. The curves are different (p = 6.7 × 10⁻⁹). The gray bar indicates the approximate age of the onset of hearing in control animals.
Figure 5.
Figure 5.
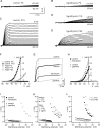
IHCs of hypothyroid rats do not acquire the fast BK conductance in the third postnatal week as IHCs of control rats do. A, B, Families of IHC outward K+ current traces of a control rat (A) and a hypothyroid rat (B) at P2 in response to step depolarizations reveal similar slow activation kinetics within the first 5 ms. C, In a P19 control IHC, a very large and rapidly activating K+ current was evident. D, E, Expression of the rapidly activating conductance was missing in a hypothyroid IHC at P19 (D) and was still incomplete in another hypothyroid IHC at P32 (E). F, I–Vs of the K+ currents in AE taken at 1.2 ms after the start of the depolarization (the time point is indicated by vertical dashed lines in AE, respectively). IHCs of the P2 control rat and of either the P2 or P19 hypothyroid animals did not show any fast K+ outward current within the whole voltage range whereas the P19 control IHC displayed a large and fast K+ current. The P32 hypothyroid IHC showed some rapidly activating current. G, Incomplete block of the fast K+ current at 0 mV of a P19 control IHC (thick black trace) by the BK channel blocker iberiotoxin (100 nm, thin black trace) and complete block of the fast K+ current at 0 mV of another P19 control IHC (thick gray trace) by the BK channel blocker paxilline (10 μm, thin gray trace). H, I–Vs taken from the cells in G at 1.2 ms after depolarization (indicated by the dashed line in G) demonstrate that paxilline, but not iberiotoxin, blocked the fast K+ current completely. I, Monoexponential activation time constants of K+ currents as a function of voltage for the cells in G and H before and during iberiotoxin and paxilline application. Control IHCs without toxin treatment and the iberiotoxin-treated control IHC had time constants of <1 ms. The control IHC treated with paxilline revealed activation time constants of 8 ms (at ∼5 mV) that declined to 2 ms (at ∼35 mV). K, Voltage-dependent monoexponential activation time constants of K+ currents for typical control and hypothyroid IHCs of different ages. A P19 control IHC and a P31 hypothyroid IHC displayed fast-activation time constants of ∼1 ms or less, whereas P9 control, P9 hypothyroid, P19 hypothyroid IHCs, and a P38 hypothyroid IHC displayed slow activation time constants decreasing from 8 to 10 ms (at ∼0 mV) to 2 ms (at ∼25 mV). L, IHCs of the same organ of Corti differed regarding the expression of the fast BK conductance in hypothyroid animals aged P31–P50. Selected individual curves of IHC K+ current activation time constants as a function of membrane potential are shown for three IHCs of a P31 (unfilled symbols) and a P38 (filled symbols) hypothyroid organ of Corti, respectively.
Figure 6.
Figure 6.
BK channel expression is severely delayed or missing in IHCs of hypothyroid rats. Whole-mount immunocytochemistry on organs of Corti of control and hypothyroid rats was performed with double staining for the BKα subunit (BK, red, closed arrowhead) and neurofilament 200 (NF 200, a marker for afferent fibers, green, arrow). Cell nuclei were stained with DAPI (blue); some of the IHC nuclei are encircled by dashed lines for better orientation. A, Typical patchy BK staining around the neck of control IHCs at P30, medial turn. B, In an organ of Corti of a P35 hypothyroid rat, no BK-positive staining could be detected at the level of the IHCs, here shown for the medial turn. C, In an organ of Corti of a hypothyroid rat at P53, medial turn, BK-positive IHCs were observed, which were, however, less intensively stained compared with the P30 control IHCs (A). They were neighboring IHCs that lacked any BK staining (cells are indicated by open arrowheads). Here, the long axis of the IHCs lies in the plane of view, whereas in A and B, long axes of the IHCs are oriented more perpendicular. The intense blue staining in the top left corners in B and C resulted from a greater number of small epithelial cells because of the delayed formation of the inner sulcus caused by TH-deficiency.
Figure 7.
Figure 7.
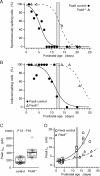
Spontaneous and induced spiking activity persists in IHCs of Pax8−/− mice beyond P12 because of changed Ca2+ and K+ currents. A, Percentage of spontaneously active IHCs as a function of age for Pax8 control and Pax8−/− IHCs and logistic fits (solid line, Pax8 control; dashed line, Pax8−/−). Pax8 control IHCs stopped spontaneous activity after P7 whereas Pax8−/− IHCs generated Ca2+ APs as late as at P14. B, By injecting small currents, Ca2+ APs could be elicited up to P12 in IHCs of Pax8 control mice, but up to P21 in IHCs of Pax8−/− animals. Logistic fits are added (solid line, Pax8 control; dashed line, Pax8−/−). n values: Pax8 control IHCs, P1, 2; P2, 6; P3, 3; P4, 4; P5, 7; P6, 9; P7, 5; P8, 2; P9, 3; P10, 5; P11, 3; P12, 4; P16, 8; P20, 1; Pax8−/− IHCs, P2, 3; P4, 5; P14, 2; P17, 2; P21, 2. C, Box-whisker plot of Ca2+ current amplitudes at 5 mm Ca2+; horizontal lines at the median (strong), 25 and 75% quantiles (box), and extreme values within 1.5× interquartile range from the box (whiskers) in 16 Pax8 controls compared with 11 Pax8−/− IHCs aged P13–P18. D, K+ current as a function of postnatal age for 29 Pax8 control and 14 Pax8−/− IHCs and regressions from logarithms of K+ currents on postnatal age (Pax8 control, solid line; Pax8−/−, dashed line). The gray bars in A,B, and D indicate the approximate age of the onset of hearing in control animals.
Figure 8.
Figure 8.
IHCs of hypothyroid rats show exocytosis at both neonatal age and at P19 when IHCs of euthyroid controls are mature. A, Top, Typical Ca2+ currents (5 mm Ca2+) of a control (black trace) and a hypothyroid IHC (dark gray trace) in response to depolarizing pulses to 0 mV for 100 ms at P9. The light gray trace shows the residual ICa in nominally Ca2+-free solution of the control IHC. Bottom, Corresponding increases in membrane capacitance indicate exocytosis in both cells in the presence of Ca2+; zero level is indicated by the dashed line. In Ca2+-free solution, no increase in capacitance was observed. B, Typical Ca2+ currents (5 mm Ca2+) of a control (black trace) and a hypothyroid IHC (dark gray trace) at P19 in response to depolarizing pulses to 0 mV for 100 ms (top). Corresponding increases in membrane capacitance indicate larger exocytosis in the hypothyroid IHC compared with the control IHC; zero level is indicated by the dashed line (bottom). C, D, ΔCm ± SEM for control and hypothyroid rat IHCs around P9 (P7–P10, C) and around P19 (P18–P22, D) as a function of the duration of a depolarizing stimulus. P9 control and hypothyroid IHCs showed similar capacitance increases as a function of stimulus duration (C). In mature control IHCs, depolarization elicited smaller capacitance increases for depolarization times ≥20 ms compared with the age-matched hypothyroid cells (D) and the two P9 IHC groups (C). E, F Mean Ca2+ charge ± SEM for euthyroid and hypothyroid rat IHCs around P9 (E) and P19 (F), respectively, as a function of stimulus duration. Ca2+ charges were calculated by integrating the absolute value of the Ca2+ current over the time of depolarization. Mature control IHCs showed the smallest influx of Ca2+ ions compared with age-matched hypothyroid IHCs (F) or with P9 euthyroid or P9 hypothyroid IHCs (E). G, H Geometric means and 95% confidence intervals of exocytosis efficiency as a function of stimulus duration for immature (P9, G) and older (P19, H) control and hypothyroid IHCs. Efficiency of exocytosis was calculated by dividing the capacitance change ΔCm by the corresponding Ca2+ charge. Numbers of IHCs: control, P9, n = 10; P19, n = 7; hypothyroid, P9, n = 8; P19, n = 5.
Figure 9.
Figure 9.
IHCs of athyroid Pax8−/− mice display large Ca2+ currents and show exocytosis with reduced efficiency. A, Typical Ca2+ inward currents (5 mm Ca2+) of a Pax8 control (black trace) and a Pax8−/− IHC (gray trace) in response to depolarizing pulses to 0 mV for 100 ms (top) at P14. Corresponding increases in capacitance indicating exocytosis are shown below; zero level is indicated by the dashed line. B, ΔCm ± SEM for 6–13 IHCs of Pax8 control and 8–10 IHCs of Pax8−/− mice aged P11–P16 as a function of the duration of the voltage pulse. Capacitance increases as a function of stimulus duration were not different for IHCs of Pax8−/− animals and Pax8 controls. C, Corresponding mean Ca2+ charge ± SEM for IHCs of Pax8 control and Pax8−/− mice as a function of the duration of the voltage pulse. IHCs of Pax8−/− animals showed a larger Ca2+ influx for stimulus durations >5 ms. D, Geometric means and 95% confidence intervals of exocytosis efficiency as a function of stimulus duration for Pax8 control and Pax8−/− IHCs.
Figure 10.
Figure 10.
The protein otoferlin is present in IHCs of Pax8−/− mice, but not expressed in IHCs of hypothyroid rats. ISH for otoferlin mRNA and immunocytochemistry for otoferlin protein in IHCs in cochlear cryosections of Pax8 mice or rats. A, ISH of otoferlin mRNA in cochlear sections of a Pax8+/+ (left) and a Pax8−/− mouse (right) showed antisense hybridization signals in IHCs of both genotypes at P12. B, IHCs of both Pax8+/+ (left) and Pax8−/− (right) were positively stained for otoferlin (red) at P12. C, E, Otoferlin mRNA present in IHCs of control rats could neither be detected in IHCs of hypothyroid rats at P9 (C) nor at P19 (E) using ISH. Nonstained IHCs are outlined by dashed lines. D, F, Accordingly, protein staining for otoferlin present in IHCs of control rats at P9 (D, left) and P19 (F, left) was absent in IHCs of age-matched hypothyroid rats (P9, D, right; P19, F, right; outlines of the IHCs are indicated by dashed lines). In B,D, and F, nuclei were stained in blue with DAPI.

Similar articles

Cited by

References

    1. Beutner D, Moser T. The presynaptic function of mouse cochlear inner hair cells during development of hearing. J Neurosci. 2001;21:4593–4599. - PMC - PubMed
    1. Brandt A, Striessnig J, Moser T. CaV1.3 channels are essential for development and presynaptic activity of cochlear inner hair cells. J Neurosci. 2003;23:10832–10840. - PMC - PubMed
    1. Brandt A, Khimich D, Moser T. Few CaV1.3 channels regulate the exocytosis of a synaptic vesicle at the hair cell ribbon synapse. J Neurosci. 2005;25:11577–11585. - PMC - PubMed
    1. Brucker-Davis F, Skarulis MC, Pikus A, Ishizawar D, Mastroianni MA, Koby M, Weintraub BD. Prevalence and mechanisms of hearing loss in patients with resistance to thyroid hormone. J Clin Endocrinol Metab. 1996;81:2768–2772. - PubMed
    1. Christ S, Biebel UW, Hoidis S, Friedrichsen S, Bauer K, Smolders JW. Hearing loss in athyroid pax8 knockout mice and effects of thyroxine substitution. Audiol Neurootol. 2004;9:88–106. - PubMed

Publication types