Comparative Study
. 2007 Mar 21;27(12):3274-84.
doi: 10.1523/JNEUROSCI.4937-06.2007.

The impact of input fluctuations on the frequency-current relationships of layer 5 pyramidal neurons in the rat medial prefrontal cortex

Affiliations
Comparative Study

The impact of input fluctuations on the frequency-current relationships of layer 5 pyramidal neurons in the rat medial prefrontal cortex

Maura Arsiero et al. J Neurosci. .

Abstract

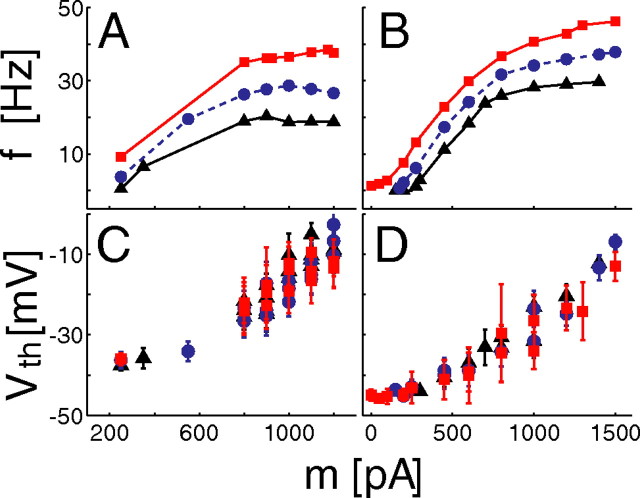
The role of irregular cortical firing in neuronal computation is still debated, and it is unclear how signals carried by fluctuating synaptic potentials are decoded by downstream neurons. We examined in vitro frequency versus current (f-I) relationships of layer 5 (L5) pyramidal cells of the rat medial prefrontal cortex (mPFC) using fluctuating stimuli. Studies in the somatosensory cortex show that L5 neurons become insensitive to input fluctuations as input mean increases and that their f-I response becomes linear. In contrast, our results show that mPFC L5 pyramidal neurons retain an increased sensitivity to input fluctuations, whereas their sensitivity to the input mean diminishes to near zero. This implies that the discharge properties of L5 mPFC neurons are well suited to encode input fluctuations rather than input mean in their firing rates, with important consequences for information processing and stability of persistent activity at the network level.


Figures

Figure 1.
Figure 1.
The neuronal discharge response retains sensitivity to input fluctuations as demonstrated by diverging f–I curves for distinct levels. A, B, The discharge response of a typical layer 5 pyramidal neuron of rat medial prefrontal cortex was quantified in terms of the mean firing rate f (A) and the coefficient of variation (CV) of the interspike intervals (B) as a function of the input current mean m. Different colors and marker shapes represent different values of the amplitude fluctuations in the input current, where SD s is 50, 150, and 300 pA (see inset in top left panel). Curves remain well separated from each other (i.e., divergent) throughout the range of m. C, For each combination (m, s), the evoked spike trains were studied at the steady state while carefully monitoring the stationarity of the spike shape at the beginning and at the end of the trace (boxes).
Figure 2.
Figure 2.
f–I curves, averaged across 80 individual cells, display divergence. Transient individual mean rate responses, obtained for a set of 80 L5 pyramidal cells (as in Fig. 6), were averaged by first shifting to the left each data point proportionally to the cell input resistance, R in. Such normalization acts as an indirect estimate of the rheobase current, m rhe. The stimulus parameters m were associated together in bins of 100 pA, whereas error bars represent the SE across the data points available in each bin (marker shapes and colors are as in Fig. 1, with s binned as 50, 100, and 300 pA). Very similar average curves were obtained analyzing steady-state responses.
Figure 3.
Figure 3.
Summary of the observed f–I curve divergence and comparison with previous results from L5 somatosensory cortex. Firing f–I curves from pyramidal neurons have been summarized by a parameter that quantifies their shape: the divergence parameter ω (see Materials and Methods). L5 cells of the somatosensory cortex generally showed no divergence (ω = 0) and were previously reported to become insensitive to s for increasing input current means m (Rauch et al., 2003; La Camera et al., 2006). Conversely, mPFC L5 pyramidal cells display a heterogeneous degree of divergence, as shown in the distribution histogram. Sketches for the cases ω = 8 and ω = 50 were reported for the sake of comparison.
Figure 4.
Figure 4.
Sensitivity to input fluctuations correlates with a modulation of the spike threshold. A–D, Panels report and compare the f–I relationships of two cells (A, B) with the steady-state spike threshold V th as a function of the input current mean m (C, D) (marker shapes and colors are as in Fig. 1). This was defined as the value of the membrane voltage V that corresponds to a rate of change dV/dt of 10 mV/ms. The steepest increase of V th on m occurs in the range of saturation for the f–I curves, allowing the firing of the neuron to become sensitive to s rather than to m.
Figure 5.
Figure 5.
Divergent f–I curves are captured by a novel integrate-and-fire model used to quantify the statistical significance of the discharge sensitivity to input fluctuations. Panels report results from four different cells as in Figure 1, two under control ACSF and two under pharmacological blockade of synaptic receptors, from top to bottom, respectively. Discharge responses were evaluated over the first 2 s of stimulation as a function of the input current mean m and variance s 2; marker shapes and colors are as in Figure 1 (50, 150, and 300 pA). Transient and steady-state f–I revealed the same degree of divergence. The f–I curves corresponding to distinct levels of input fluctuations s are well approximated by the extended (sLIF) integrate-and-fire dynamics but not by the conventional LIF model. Responses were compared with the best-fit predictions (lines) provided by the novel (left) and the conventional IF (right) model. Whereas the χ2 test was always well above significance for the sLIF (i.e., p χ > 0.1), the LIF model gave f–I curves that differed from experimental data, as apparent from the increased mean absolute error e and by inspection.
Figure 6.
Figure 6.
The significance of f–I curve divergence was quantified by the superior fit performance of the model incorporating the extrasensitivity to input fluctuations. This plot displays the goodness of model fits between the extended (sLIF) and conventional (LIF) leaky integrate-and-fire models and data from 80 cells recorded over the first 2 s of stimulation without pharmacological blockers. For each cell, the performance was related to the narrowest confidence interval, corresponding to a successful χ2 test with p χ > 0.1 (see Results and Eq. S2). K is the number of SDs used to compute statistical confidence for each data point. K ≤ 1 was chosen as the condition for significance (dashed line) to facilitate comparison with previous reports in the literature.
Figure 7.
Figure 7.
Slow sodium inactivation is sufficient to account for f–I curve divergence in biophysical models of action potential generation. A, B, Introducing slow sodium inactivation and its recovery process (Fleidervish et al., 1996; Miles et al., 2005) in the standard Hodking–Huxley model (A) and in a neocortical point neuron (see Materials and Methods) (B) causes the neuron to effectively modulate its firing threshold in response to slow components of the input current. The plots replicate the experimental protocol of Figure 1 A for the Hodgkin–Huxley and neocortical models with (solid lines) and without (dotted lines) the slow sodium inactivation. s was set to [64 96 128] pA in A and [80 120 160] pA in B. Colors are as in Figures 1, 2, S1, and S2.
Figure 8.
Figure 8.
Divergent single-cell f–I curves increase the stability of persistent activity states emerging in recurrent random networks of IF model neurons. We compared populations of IF neurons with divergent f–I curves (sLIF) to populations of conventional leaky IF neurons (LIF). A, Existence and location of persistent states were studied as a bifurcation diagram, ΔJ denoting the range of J for which a spontaneous activity state and a persistent activity state simultaneously exist. d is the maximal width of the basin of attraction of the spontaneous activity state. In B and C, the robustness of the network bistability was studied by evaluating ΔJ and d as functions of F 0, which was regarded as a source of interference to the emergence or maintenance of network persistent states. In networks of sLIF neurons, the range of F 0 corresponding to two simultaneous equilibria was extended by ∼300% (B, C), and the sensitivity of d on F 0 (i.e., ∂d/F 0) was significantly reduced (C) compared with the performance of an identical network composed of LIF neurons. Model parameters are as follows: α = 0 pA s, τm = 21.8 ms, C = 190.8 pF, H = −5.3 mV, τarp = 15.5 ms, and ω = 10.2 ms pA (sLIF) or ω = 0 ms pA (LIF).
Figure 9.
Figure 9.
Networks of model neurons compute either the SD or the mean of a global input during persistent activity. Excitatory IF neurons, alternatively characterized either as sLIF neurons with divergent f–I curves or as standard LIF neurons with convergent f–I curves, were assumed to be embedded into a larger pool of cells. The coexistence of an internally generated network state and of an external feedforward input i ext(t) was simplified by approximating the effect of i ext(t) as a modulation around two working points in the single neuron f–I curves (Eqs. 2, 3). For the sake of illustration, i ext(t) was a noisy waveform, characterized by a time-varying mean m(t) and a sinusoidally modulated variance s(t)2. The dotted blue line represents m(t), and the solid red lines represent m(t) ± s(t) (center inset). In the down state, the responses of the two networks are almost indistinguishable, whereas they significantly differ in the up state. In fact, in B, neurons exclusively propagate information encoded by m(t) (dashed line), whereas in D, they are strongly sensitive to s(t) (dashed line). Model parameters are as follows: A, best-fit response function as in Figure 8 C (left) of Rauch et al. (2003) (i.e., α = 5.3 pA s, τm = 21.5 ms, C = 250 pF, H = 1.9 mV, and τarp = 4.2 ms, ω = 0); C, best-fit response function of a typical mPFC cell with similar effective membrane time constant (parameters as in Fig. 8); A, B, (m down, s down) = (100, 0) pA and (m up, s up) = (600, 50) pA; C, D, (m down, s down) = (21, 0) pA and (m up, s up) = (600, 50) pA.

Similar articles

Cited by

References

    1. Ahmed B, Anderson JC, Douglas RJ, Martin KA, Whitteridge D. Estimates of the net excitatory currents evoked by visual stimulation of identified neurons in cat visual cortex. Cereb Cortex. 1998;8:462–476. - PubMed
    1. Amit DJ, Brunel N. Model of global spontaneous activity and local structured activity during delay periods in the cerebral cortex. Cereb Cortex. 1997a;7:237–252. - PubMed
    1. Amit DJ, Brunel N. Dynamics of a recurrent network of spiking neurons before and following learning. Netw Comput Neural Syst. 1997b;8:373–404.
    1. Brette R, Gerstner W. Adaptive exponential integrate-and-fire model as an effective description of neuronal activity. J Neurophysiol. 2005;94:3637–3642. - PubMed
    1. Brody CD, Romo R, Kepecs A. Basic mechanisms for graded persistent activity: discrete attractors, continuous attractors, dynamic representations. Curr Opin Neurobiol. 2003;13:204–211. - PubMed

Publication types

LinkOut - more resources