. 2007 Jul;44(13):3434-44.
doi: 10.1016/j.molimm.2007.02.011. Epub 2007 Mar 26.

Defective B cell ontogeny and immune response in human complement receptor 2 (CR2, CD21) transgenic mice is partially recovered in the absence of C3

Affiliations

Defective B cell ontogeny and immune response in human complement receptor 2 (CR2, CD21) transgenic mice is partially recovered in the absence of C3

Jason Twohig et al. Mol Immunol. 2007 Jul.

Abstract

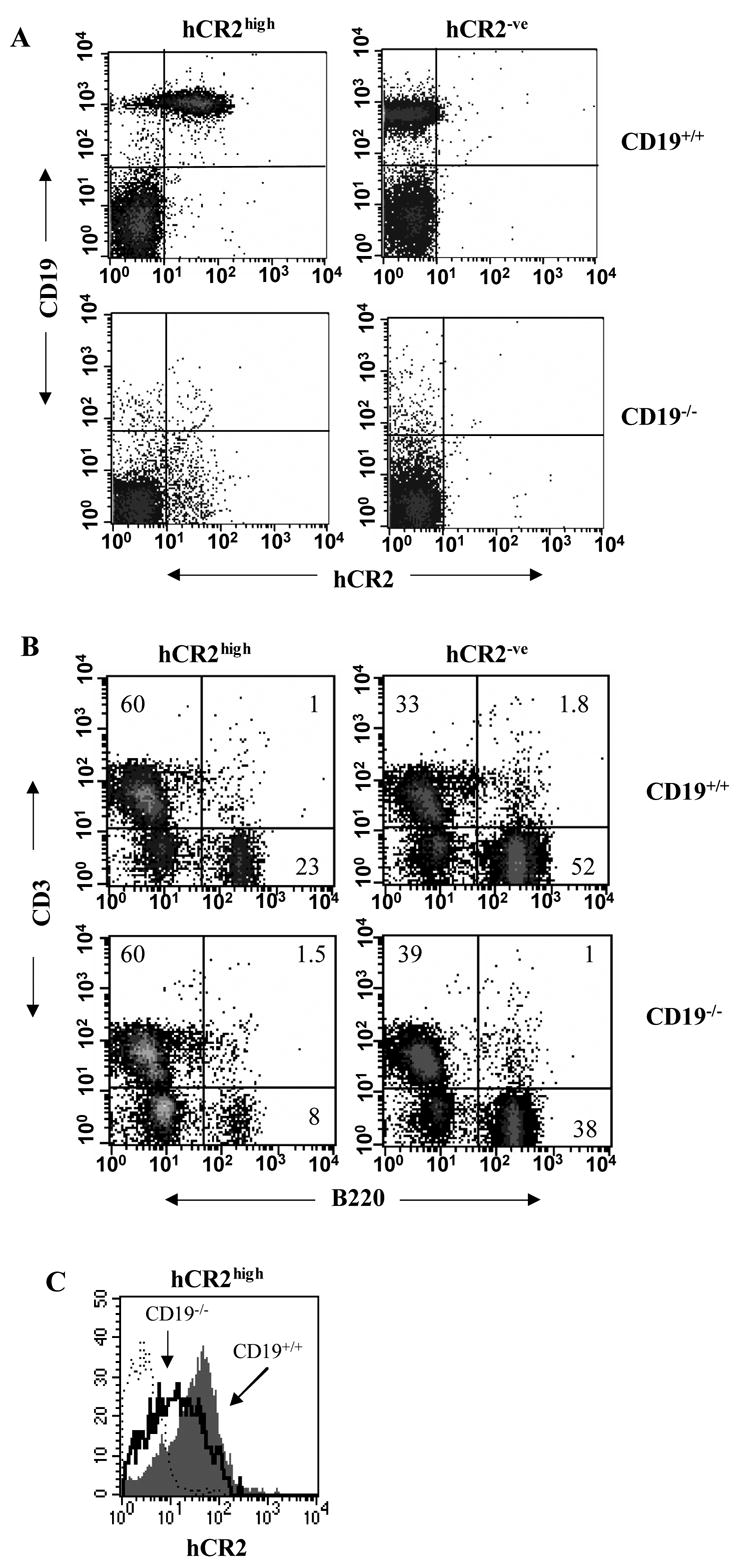
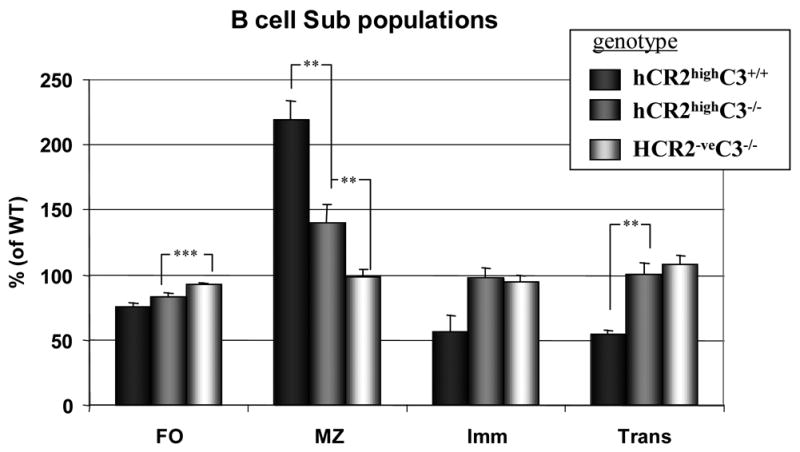
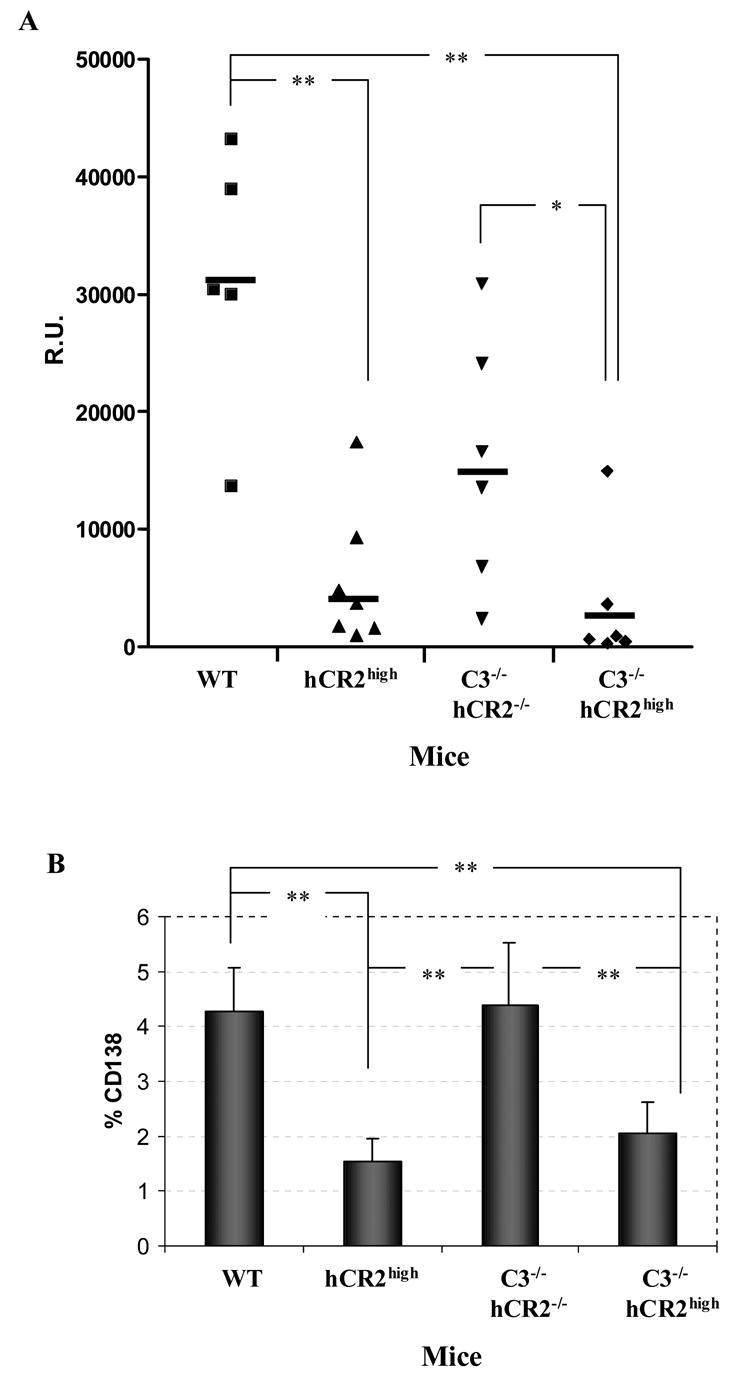
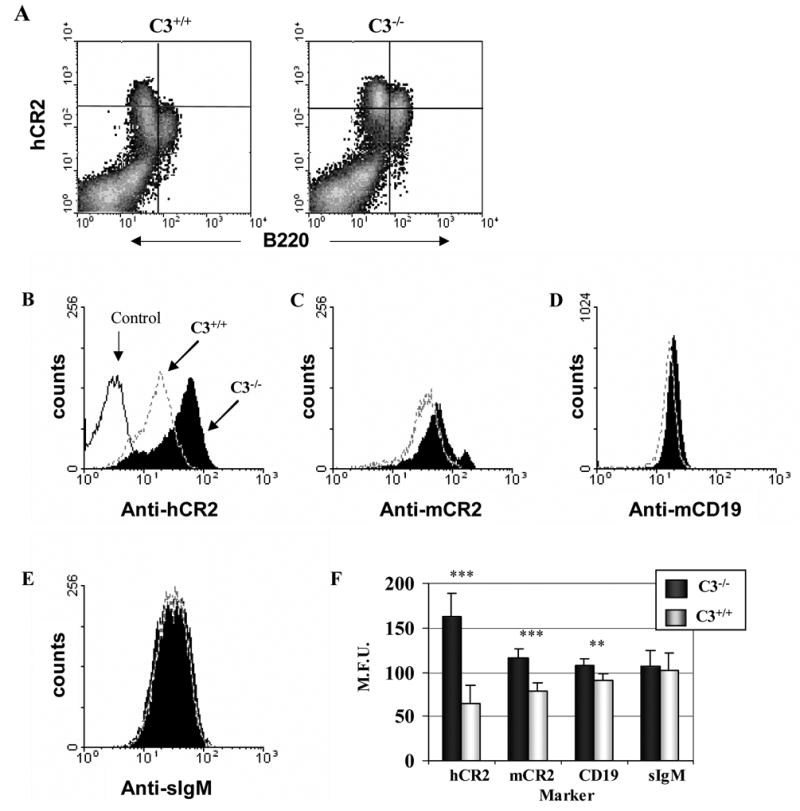
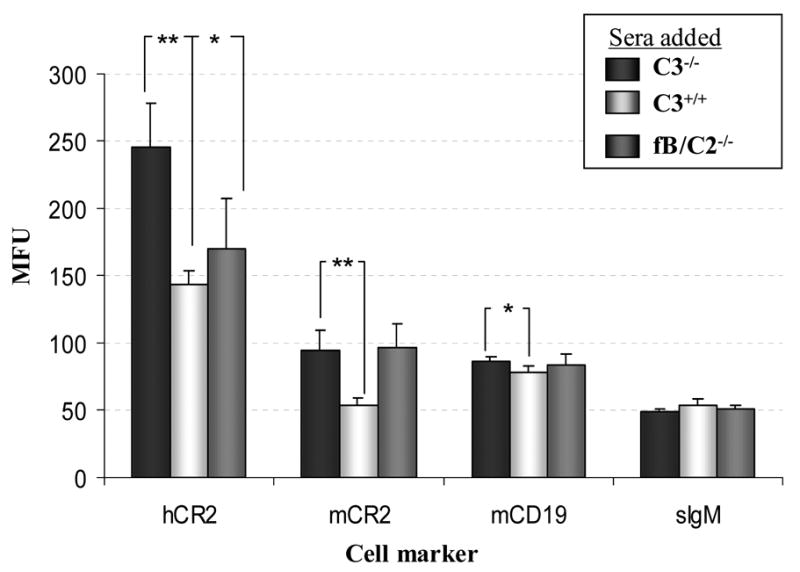
Mice prematurely expressing human CR2 (hCR2) in the B cell lineage have a defective B cell ontogeny and immune response. Our recent analysis of this phenotype suggested that signaling through hCR2 and presumably mouse CD19 on the B cell surface, during bone marrow development, could result in the observed changes in B cell function in these mice. To test this hypothesis, we back crossed hCR2(high) transgenic mice onto the CD19(-/-) background. CD19(-/-)hCR2(high) mice were found to possess even fewer mature B cells than their CD19(+/+)hCR2(high) littermates, demonstrating that loss of CD19 exacerbated the effects elicited through hCR2. This data suggests that CD19 provides a survival signal during B cell development in this model. Next, we examined if the removal of the main ligand for CR2, namely C3d, through back-crossing onto the C3(-/-) background could restore normal B cell development. However, we found only minor recovery in peripheral B cell numbers and no obvious change in function. This was despite a three-fold increase in the level of hCR2 expression on B cells isolated from the spleen or bone marrow of C3(-/-)hCR2(high) mice when compared with C3 sufficient littermates. These data demonstrate that hCR2 is integrated in mouse B cell signaling and that the downstream effects of hCR2 expression during early B cell development are partially but not completely due to interaction with C3 fragments and signaling through CD19 in the bone marrow environment.


Figures

Fig 1
Fig 1. Analysis of CD19−/−hCR2+ tg mouse B cells
Splenocytes were isolated from littermates of each genotype as indicated in materials and methods. A) Cells were stained for CD19 and hCR2 to confirm the genotype of the mice B) Cells were stained with B220 and anti-CD3ε to identify B and T cells, respectively. The percentage of cells falling into each quadrant is indicated. Results are representative of 10 WT (CD19+/+hCR2−/−), 14 CD19+/+hCR2high, 5 CD19−/−hCR2−/− and 7 CD19−/−hCR2high littermates. C) Expression level of hCR2 was determined on B220 positive splenocytes in the presence (gray filled histogram) or absence (solid black line) of CD19. Background binding of anti-hCR2 to splenocytes from CD19+/+hCR2−/− (dashed line) is also included. Results are representative of 5 CD19−/−hCR2high and 8 CD19+/+hCR2high littermates.
Fig 2
Fig 2. Analysis of C3−/−hCR2+ sera by Western blot
Heparinised sera was collected from backcrossed hCR2high and C3−/− mice. Diluted sera were run-out on a 10% reducing SDS-PAGE gel and blotted onto nitrocellulose as described in materials and methods. Mouse C3 was detected using a rabbit anti-mouse C3 polyclonal antibody follow by a HRPO conjugated secondary. ECL western blotting substrate was used to visualize bound antibody. Wild type C57BL/6 sera was used as positive control (+) and sera from the original C3−/− knockout colony was used as negative control (−). Individual mouse codes are noted and an asterisk denotes hCR2 positive mice. The arrow points to the C3 α chain and molecular weight markers are shown.
Fig 3
Fig 3. B cell subpopulation distribution is restored towards wild type levels in C3−/− hCR2high mice
Splenocytes were isolated from littermates of mice with the genotype indicated. Cells were stained with B220-PerCP, Biotin anti-CD23 + SA-APC, anti-CD1d-PE and anti-CD24-FITC to allow B cells to be sub divided into Follicular (FO; B220+CD23hiCD24dullCD1ddull), Marginal Zone (MZ; B220+CD23dullCD24intCD1dhi), Immature (Imm; B220+CD23dullCD24hiCD1dint) and Transitional (Trans; B220+CD23hiCD24hiCD1dint) B cell sub populations. The number of cells falling into each of these groups is expressed as a percentage of mean values for 12 age and sex matched wild type mice. Each bars represent the mean and S.E.M. from 5 C3+/+hCR2high (black filled), 12 C3−/−hCR2high (dark gray filled) and 12 C3−/−hCR2 negative (light gray filled) mice for each sub population. The Mann-Whitney test was used to determine the p values; ** p<0.005; ***p<0.0001.
Fig 4
Fig 4. hCR2 tg mice have an unresponsive phenotype regardless of C3 status
Mice were injected with sheep red blood cells (SRBC) as described in material and methods. One week after an antigen boost, serum and splenocytes were collected from mice. (A) Anti-SRBC titre was established by flow cytometric analysis as described in materials and methods. Reference serum was used to generate a standard curve from which R.U. could be calculated. (B) The percentage plasma cells (B220+CD138+) in the spleen were established after immunization of each genotype. Age and sex matched mouse groups include: 5 WT (Wild type; C3+/+hCR2−/−); 7 hCR2high (C3+/+hCR2high); 6 C3−/− hCR2−/− and 6 C3−/−hCR2high. The Mann-Whitney test was used to determine the p values; *p<0.05, ** p<0.005.
Fig 5
Fig 5. B cell expression levels of hCR2 increase in the absence of C3
(A) Bone marrow cells were collected from C3+/+hCR2high and C3−/−hCR2high mice as described in materials and methods. Cells were stained for B220 and hCR2 (using biotin-b171+ SA-PE). The results shown are of the closest to mean values, for each genotype, of the 6 mice analysed. (B–F) Splenocytes were isolated as described in materials and methods. Cells were stained with B220 and various B cell markers as depicted. Shown are B220+ cells from C3+/+hCR2high (dashed line) and C3−/−hCR2high (solid filled histogram) mice stained with (B) anti-hCR2 (b171 +SA-PE). Background staining of the anti-hCR2 antibody on C3+/+hCR2−ve mice is represented by the solid line. (C) anti-mCR1/2 (b7E9 + SA-PE) (D) anti-CD19-PE (E) goat anti-IgM-Cy5.5. (F) Shows a bar chart of the average staining for these markers with S.E.M. of 6 age and sex matched C3+/+hCR2high (light grey) and C3−/−hCR2high (solid black) littermates. The Mann-Whitney test was used to determine the p values; *p<0.05, ** p<0.005; ***p<0.0005.
Fig 6
Fig 6. Incubation of C3−/−hCR2high B cells ex vivo with mouse C3 containing sera rapidly reduces B cell expression of hCR2
Isolated splenocytes from four C3−/−hCR2high mice were incubated for 120 minutes with C3−/− sera (black bar); normal mouse sera (C3+/+, light gray bar) or C2/fB−/− (dark gray bar) and then flow cytometry was carried out to determine the effects on cell surface markers. The mean and S.E.M. is shown for each marker analysed. Results shown are representative of 2 independent experiments.
Fig 7
Fig 7. In vivo reconstitution of C3−/−hCR2high mice with hC3 results in reduction in hCR2 expression levels
Age and sex matched C3−/−hCR2high mice were injected I.P. with 3mg of purified hC3 in PBS (open square, 6 mice) or PBS alone (filled square, 6 mice). 4 hours post injection, bone marrow and spleen were harvested as described in materials and methods. (A) shows bone marrow staining and (B) shows staining of splenocytes. B cells were identified using B220-FITC and levels of cell markers established using the appropriate antibodies and standard flow cytometry. The Mann-Whitney test was used to determine the p values; *p<0.05, ** p<0.01.

Similar articles

Cited by

References

    1. Ahearn JM, Fischer MB, Croix D, Goerg S, Ma M, Xia J, Zhou X, Howard RG, Rothstein TL, Carroll MC. Disruption of the Cr2 locus results in a reduction in B-1a cells and in an impaired B cell response to T-dependent antigen. Immunity. 1996;4:251–62. - PubMed
    1. Asokan R, Hua J, Young KA, Gould HJ, Hannan JP, Kraus DM, Szakonyi G, Grundy GJ, Chen XS, Crow MK, Holers VM. Characterization of human complement receptor type 2 (CR2/CD21) as a receptor for IFN-alpha: a potential role in systemic lupus erythematosus. J Immunol. 2006;177:383–94. - PubMed
    1. Baechler EC, Batliwalla FM, Karypis G, Gaffney PM, Ortmann WA, Espe KJ, Shark KB, Grande WJ, Hughes KM, Kapur V, Gregersen PK, Behrens TW. Interferon-inducible gene expression signature in peripheral blood cells of patients with severe lupus. Proc Natl Acad Sci U S A. 2003;100:2610–5. - PMC - PubMed
    1. Benschop RJ, Brandl E, Chan AC, Cambier JC. Unique signaling properties of B cell antigen receptor in mature and immature B cells: implications for tolerance and activation. J Immunol. 2001;167:4172–9. - PubMed
    1. Billips LG, Nunez CA, Bertrand FE, 3rd, Stankovic AK, Gartland GL, Burrows PD, Cooper MD. Immunoglobulin recombinase gene activity is modulated reciprocally by interleukin 7 and CD19 in B cell progenitors. J Exp Med. 1995;182:973–82. - PMC - PubMed

Publication types