. 2007 Jun 1;581(Pt 2):693-708.
doi: 10.1113/jphysiol.2007.129866. Epub 2007 Mar 22.

G protein-independent neuromodulatory action of adenosine on metabotropic glutamate signalling in mouse cerebellar Purkinje cells

Affiliations

G protein-independent neuromodulatory action of adenosine on metabotropic glutamate signalling in mouse cerebellar Purkinje cells

Toshihide Tabata et al. J Physiol. .

Abstract

Adenosine receptors (ARs) are G protein-coupled receptors (GPCRs) mediating the neuromodulatory actions of adenosine that influence emotional, cognitive, motor, and other functions in the central nervous system (CNS). Previous studies show complex formation between ARs and metabotropic glutamate receptors (mGluRs) in heterologous systems and close colocalization of ARs and mGluRs in several central neurons. Here we explored the possibility of intimate functional interplay between G(i/o) protein-coupled A(1)-subtype AR (A1R) and type-1 mGluR (mGluR1) naturally occurring in cerebellar Purkinje cells. Using a perforated-patch voltage-clamp technique, we found that both synthetic and endogenous agonists for A1R induced continuous depression of a mGluR1-coupled inward current. A1R agonists also depressed mGluR1-coupled intracellular Ca(2+) mobilization monitored by fluorometry. A1R indeed mediated this depression because genetic depletion of A1R abolished it. Surprisingly, A1R agonist-induced depression persisted after blockade of G(i/o) protein. The depression appeared to involve neither the cAMP-protein kinase A cascade downstream of the alpha subunits of G(i/o) and G(s) proteins, nor cytoplasmic Ca(2+) that is suggested to be regulated by the beta-gamma subunit complex of G(i/o) protein. Moreover, A1R did not appear to affect G(q) protein which mediates the mGluR1-coupled responses. These findings suggest that A1R modulates mGluR1 signalling without the aid of the major G proteins. In this respect, the A1R-mediated depression of mGluR1 signalling shown here is clearly distinguished from the A1R-mediated neuronal responses described so far. These findings demonstrate a novel neuromodulatory action of adenosine in central neurons.


Figures
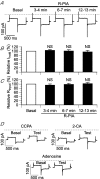
Figure 8
Figure 8. A1R-mediated mGluR1 depression is not associated with a change in the background conductance
A, sample voltage step-evoked currents of a Purkinje cell recorded before (Basal) and during local application of R-PIA (50 nm). Each trace indicates the average of three records obtained at the labelled time after R-PIA onset. Dotted line, zero-current level. The input resistance (Rinput) was estimated from a difference between mean current levels over the last 95 ms of ±5 mV steps. Holding potential, −70 mV (perforated-patch mode with the Cs+-containing pipette solution). B and C, the mean holding current levels (Ihold) (average level over a 95 ms period prior to the first voltage step; an inward deflection indicated as a positive value) and mean Rinput at the labelled period. For each cell, the basal value was taken as 100%. n = 5 cells. NS, P > 0.05 compared with the basal values (paired t test for the raw data). D, sample voltage step (±5 mV)-evoked currents before (Basal) and during (at 12–13 min after drug onset, Test) local application of CCPA (500 nm), 2-CA (30 μm), or adenosine (400 nm). Each pair of traces was obtained from a different cell, using the same procedures as in A.
Figure 1
Figure 1. A1R activation depresses mGluR1 signalling
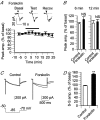
AC, bath application of A1R-selective agonists (R-PIA, 50 nm, 7 cells; CCPA, 500 nm, 7 cells) but not the normal saline (control, 7–8 cells) depresses mGluR1-coupled inward currents evoked by DHPG (50 μm, applied locally for 10 s) in cerebellar Purkinje cells. The cells were voltage-clamped at –70 mV in a perforated-patch whole-cell mode. Traces in each panel indicate sample responses recorded from a single cell before (Basal), during (Test), and after (Recov.) bath application. Arrowhead, DHPG onset. Each plot summarizes the mean peak amplitude of the inward currents as a function of time. For each cell, the peak amplitude is percentage scored, taking the average of three basal records as 100%. Thick bar, bath application period. The same conventions of data acquisition and presentation apply to Figs 1–6 and 10. In some cases with R-PIA, bath application of this agent was extended to seek the plateau of its effect (see Results); the commencement of the recovery time courses was aligned to a time of 12 min in the plot. D, comparison of the effects of the labelled test agents by the mean peak amplitudes at 12 min of bath application onset. Data were collected from the same cells used in A–C. *P < 0.05 and **P < 0.01 compared with the control, respectively (rank score test).
Figure 2
Figure 2. A2AR and A3R are not important for mGluR1 signalling depression
A and B, neither an A2AR agonist (CGS21680, bath-applied at 150 nm, 7 cells) nor an A3R agonist (HEMADO, bath-applied at 30 nm, 7 cells) depresses DHPG (50 μm, 10 s)-evoked inward currents. C, comparison of the effects of the labelled test agents by the mean peak amplitudes at 3 min after bath application onset. Control, the normal saline (8 cells, reproduced from Fig. 1). CGS and HEMADO, data collected from the same cells used in A and B, respectively. NS, P > 0.05 compared with the control (rank score test).
Figure 3
Figure 3. Gi/o protein activation via GABABR augments mGluR1 signalling
A and B, bath application of a GABABR-selective agonist (baclofen, 1 μm, 7 cells, B) but not the normal saline (control, 7 cells, A) induces the augmentation of DHPG (10 s)-evoked inward currents. Only in these experiments, DHPG was applied at a saturating dose (500 μm, see Results for further explanation). C, comparison of the effects of the normal saline and baclofen by the mean peak amplitudes at 12 min after bath application onset. Data were collected from the same cells used in A and B. **P < 0.01 compared with the control (rank score test).
Figure 4
Figure 4. A1R-mediated mGluR1 signalling depression does not require Gi/o protein
A, pretreatment with a Gi/o protein uncoupler (PTX, 500 ng ml−1, for 16 h or longer, 7 cells) does not abolish the R-PIA (50 nm, bath-applied)-induced depression of DHPG (50 μm, 10 s)-evoked inward currents. B, comparison of the effects of the labelled test agents by the mean peak amplitudes at 12 min after bath application onset. Control, the normal saline without the PTX pretreatment (8 cells, reproduced from Fig. 1). R-PIA, R-PIA (50 nm) without the PTX pretreatment (7 cells, reproduced from Fig. 1). PTX + R-PIA, data collected from the same cells used in A. **P < 0.01 and NS, P > 0.05, respectively (rank score test). C, R-PIA (500 nm, 9 cells) but not the normal saline (control, 11 cells) induces an inwardly rectifying current, which is suppressed by the PTX pretreatment (500 ng ml−1, for 16 h or longer, 9 cells, PTX + R-PIA). Each plot indicates the mean (black line) and s.e.m. (grey lines) of the I–V relations of a current induced by the labelled agent that was extracted as a difference between the total currents evoked by voltage ramps before and after a 2 min local application of the agents. The Purkinje cells were voltage clamped in a ruptured-patch whole-cell mode. Note that the R-PIA-induced current has a reversal potential (−58.3 ± 4.9 mV) close to the EK (−56.7 mV). D, comparison of the amplitudes at –130 mV of currents induced by the labelled test agents. Data were collected from the same cells used in C. NS, P > 0.05 and **P < 0.01, respectively (ANOVA and unpaired t test).
Figure 5
Figure 5. A1R exerts the opposite actions on mGluR1 signalling through Gi/o protein-dependent and -independent pathways
A and B, bath application of a high dose of a potent AR agonist (2-CA, 30 μm) augments DHPG (50 μm, 10 s)-evoked inward currents transiently prior to inducing depression in PTX-untreated Purkinje cells (6 cells, A) but not in PTX-pretreated cells (500 ng ml−1, over 16 h, 6 cells, B). Test 3 min and Test 12 min, responses at 3 min and 12 min after 2-CA onset. C, comparison of the effects of the labelled test agents by the mean peak amplitudes at 3 min and 12 min after bath application onset. Control, the normal saline without the PTX pretreatment (8 cells, reproduced from Fig. 1). 2-CA, 2-CA without the PTX pretreatment, data collected from the cells used in A. PTX + 2-CA, 2-CA with the PTX pretreatment, data collected from the same cells used in B. *P < 0.05 and **P < 0.01 compared with the control, respectively (rank score test).
Figure 6
Figure 6. cAMP insensitivity of mGluR1 signalling
A, bath application of an adenylyl cyclase activator (forskolin, 20 μm) has little effect on the amplitude of DHPG (50 μm, 10 s)-evoked inward currents (7 cells). B, comparison of the effects of the normal saline (7–8 cells, reproduced from Fig. 1) and forskolin (7 cells, data collected from the cells used in A) by the mean peak amplitudes at 6 min and 12 min after bath application onset. NS, P > 0.05 (rank score test). C, forskolin (20 μm) indeed changes cAMP level as it augments Ih. Each set of superimposed traces indicates sample responses of a cell obtained before (grey thick line) and after (thin black line) a 2 min local application of forskolin. Schematics below the traces, voltage protocol. The Purkinje cells were voltage clamped in the ruptured-patch whole-cell mode. D, comparison of the steady-state amplitudes of the time-dependent components of Ih after application of the normal saline (Control, 11 cells) or forskolin (8 cells). **P < 0.01 compared with the control, rank score test.
Figure 7
Figure 7. Gq protein is not coupled to A1R
A, local application of R-PIA (500 nm, 30) as well as the normal saline (30 s) does not evoke an inward current, unlike DHPG (50 μm, 10 s). Traces indicate the sample responses of a cell. Arrowheads, local application onset. Holding potential, −70 mV (perforated-patch whole-cell mode). The GIRK current was blocked with 5 mm Cs+ in the saline (Tabata et al. 2005). B, comparison of the mean maximal inward deflections during application of the labelled test drugs. NS, P > 0.05 and **P < 0.01 compared with the control, respectively (ANOVA and paired t test).
Figure 9
Figure 9. A1R-mediated depression is not observed for AMPAR-mediated signalling
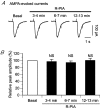
A, sample AMPA (10 μm)-evoked currents of a Purkinje cell recorded before (Basal) and during bath application of R-PIA (50 nm). Each trace indicates the average of three records obtained at the labelled time after R-PIA onset. AMPA-containing saline was applied for 100 ms locally through one of the two barrels of a theta pipette, and then the control saline was applied for 1 s through the other barrel to wash out AMPA. Holding potential, −70 mV (perforated-patch mode with the Cs+-containing pipette solution and the standard saline without a blocker against AMPA-type glutamate receptors). B, the mean peak amplitudes of the AMPA-evoked currents at the labelled period. For each cell, the basal value was taken as 100%. Data obtained from 5 cells. NS, P > 0.05 compared with the basal values (paired t test for the raw data).
Figure 10
Figure 10. Physiological levels of adenosine depress mGluR1 signalling
A and B, bath application of an endogenous A1R agonist (adenosine) at physiological concentrations (40 nm, 8 cells; 400 nm, 7 cells) depresses DHPG (50 μm, 10 s)-evoked inward currents. C, comparison of the effects of the labelled test agents by the mean peak amplitudes at 12 min after bath application onset. Control, the normal saline (8 cells, reproduced from Fig. 1). 40 nm and 400 nm, data with adenosine collected from the same cells used in A and B, respectively. *P < 0.05 compared with the control (rank score test).
Figure 11
Figure 11. A1R-mediated depression is also seen for mGluR1-coupled intracellular Ca2+ mobilization
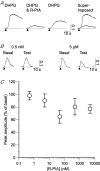
A, co-applied R-PIA (50 nm, & R-PIA) reduces the DHPG (50 μm)-evoked [Ca2+]i rise in wild-type (WT) Purkinje cells. From left to right: sample responses of a cell to local application of the labelled agents (10 s from arrowheads) obtained consecutively at an interval of 13 min. Superimposed, the left two traces are superimposed and justified at application onset; note that the response to co-applied DHPG and R-PIA decelerates after 4.4 s of drug onset. The saline contained 2 mm Ca2+. Vertical calibration bars, change in F340/F380. B and C, R-PIA dose dependence of depression of the DHPG (5 μm, 10 s)-evoked [Ca2+]i rise. In this and the following figures, the saline contained 2 mm Ca2+. B, each set of traces indicates sample responses of a cell before (Basal) and after (Test) a 12 min local application of the labelled dose of R-PIA. C, mean peak amplitude of the [Ca2+]i rise after R-PIA application plotted against logarithmic-scaled R-PIA dose. n = 5–10 cells for each point.
Figure 12
Figure 12. A1R-mediated depression of mGluR1-coupled intracellular Ca2+ mobilization is independent of Gi/o protein or PKA
A and B, R-PIA-induced depression of the DHPG (5 μm, 10 s)-evoked [Ca2+]i rise persists after inhibition of Gi/o protein. A, each set of traces indicates sample responses of a cell obtained before and after a 12 min local application of the normal saline (Control) or 50 nm R-PIA. PTX +, cell pretreated with PTX (500 ng ml−1) for >16 h before the recording. NF023 +, cell treated with NF023 (10 μm) continuously for >15 min prior to and throughout the recording. B, comparison of the mean peak amplitudes of the [Ca2+]i rises after application of the normal saline or R-PIA. N = 7–11 cells for each group. *P < 0.05, **P < 0.01, and NS, P > 0.05 (rank score test). C and D, inhibition of PKA does not mimic A1R-mediated depression. C, each set of traces indicates sample DHPG (5 μm, 10 s)-evoked [Ca2+]i rises of a cell obtained before and after a 12 min local application of DMSO (0.01% v/v, vehicle for KT5720, Control) or 1 μm KT5720. D, comparisons of the mean peak amplitudes of the [Ca2+]i rises after application of the test drugs. n = 8–9 cells for each group. NS, P > 0.05 compared with the control (rank score test).
Figure 13
Figure 13. Genetic depletion of A1R abolishes A1R-mediated mGluR1 depression
AF, R-PIA or adenosine depresses the DHPG-evoked [Ca2+]i rise in WT Purkinje cells but not in A1R-KO cells without affecting the resting [Ca2+]i. A and D, each set of traces indicates sample DHPG (5 μm, 10 s)-evoked [Ca2+]i rises obtained from a cell before and after a 12 min local application of 50 nm R-PIA or 400 nm adenosine. B, C, E, and F, comparisons of the mean peak amplitudes of the [Ca2+]i rises and the mean resting [Ca2+]i after application of R-PIA (B and C) or adenosine (E and F). n = 7 WT cells (data reproduced from the previous figure) and n = 10 A1R-KO cells in B and C, and 17 WT cells and 10 A1R-KO cells in E and F. *P < 0.05 and NS, P > 0.05 compared with the WT cells (rank score test).

Similar articles

Cited by

References

    1. Abbracchio MP, Ceruti S, Brambilla R, Franceschi C, Molorni W, Jacobson KA, von Lubitz DKJE, Cattabeni F. Modulation of apoptosis by adenosine in the central nervous system: a possible role for A3 receptor. Ann N Y Acad Sci. 1997;825:11–22. - PMC - PubMed
    1. Aiba A, Kano M, Chen C, Stanton ME, Fox GD, Herrup K, Zwingman TA, Tonegawa S. Deficient cerebellar long-term depression and impaired motor learning in mGluR1 mutant mice. Cell. 1994;79:377–388. - PubMed
    1. Balaban CD, Wurpel JND, Servers WB. A specific harmaline-evoked increase in cerebellar 5′-nucleotidase activity. Neurosci Lett. 1984;50:111–116. - PubMed
    1. Ballarin M, Fredholm BB, Ambrosio S, Mahy N. Extracellular levels of adenosine and its metabolites in the striatum of awake rats: inhibition of uptake and metabolism. Acta Physiol Scand. 1991;142:97–103. - PubMed
    1. Batchlor AM, Garthwaite J. Frequency detection and temporally dispersed synaptic signal association through a metabotropic glutamate receptor pathway. Nature. 1997;385:74–77. - PubMed

Publication types

MeSH terms

Substances