Sleep/wake fragmentation disrupts metabolism in a mouse model of narcolepsy
- PMID: 17379635
- PMCID: PMC2075199
- DOI: 10.1113/jphysiol.2007.129510
Sleep/wake fragmentation disrupts metabolism in a mouse model of narcolepsy
Abstract
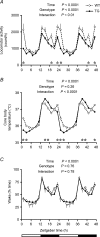
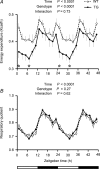
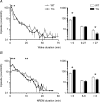
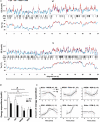
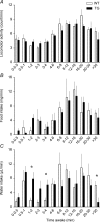
Recent population studies have identified important interrelationships between sleep duration and body weight regulation. The hypothalamic hypocretin/orexin neuropeptide system is able to influence each of these. Disruption of the hypocretin system, such as occurs in narcolepsy, leads to a disruption of sleep and is often associated with increased body mass index. We examined the potential interrelationship between the hypocretin system, metabolism and sleep by measuring locomotion, feeding, drinking, body temperature, sleep/wake and energy metabolism in a mouse model of narcolepsy (ataxin-ablation of hypocretin-expressing neurons). We found that locomotion, feeding, drinking and energy expenditure were significantly reduced in the narcoleptic mice. These mice also exhibited severe sleep/wake fragmentation. Upon awakening, transgenic and control mice displayed a similar rate of increase in locomotion and food/water intake with time. A lack of long wake episodes partially or entirely explains observed differences in overall locomotion, feeding and drinking in these transgenic mice. Like other parameters, energy expenditure also rose and fell depending on the sleep/wake status. Unlike other parameters, however, energy expenditure in control mice increased upon awakening at a greater rate than in the narcoleptic mice. We conclude that the profound sleep/wake fragmentation is a leading cause of the reduced locomotion, feeding, drinking and energy expenditure in the narcoleptic mice under unperturbed conditions. We also identify an intrinsic role of the hypocretin system in energy expenditure that may not be dependent on sleep/wake regulation, locomotion, or food intake. This investigation illustrates the need for coordinated study of multiple phenotypes in mouse models with altered sleep/wake patterns.
Figures

Similar articles
-
Increase of histaminergic tuberomammillary neurons in narcolepsy.Ann Neurol. 2013 Dec;74(6):794-804. doi: 10.1002/ana.24019. Ann Neurol. 2013. PMID: 24006291
-
Noninvasive detection of sleep/wake changes and cataplexy-like behaviors in orexin/ataxin-3 transgenic narcoleptic mice across the disease onset.Exp Neurol. 2014 Nov;261:744-51. doi: 10.1016/j.expneurol.2014.08.004. Epub 2014 Aug 10. Exp Neurol. 2014. PMID: 25118620 Free PMC article.
-
Effects of ambient temperature on sleep and cardiovascular regulation in mice: the role of hypocretin/orexin neurons.PLoS One. 2012;7(10):e47032. doi: 10.1371/journal.pone.0047032. Epub 2012 Oct 8. PLoS One. 2012. PMID: 23056568 Free PMC article.
-
Orexins: from neuropeptides to energy homeostasis and sleep/wake regulation.J Mol Med (Berl). 2002 Jun;80(6):329-42. doi: 10.1007/s00109-002-0322-x. Epub 2002 Apr 5. J Mol Med (Berl). 2002. PMID: 12072908 Review.
-
Hypocretins (orexins): clinical impact of the discovery of a neurotransmitter.Sleep Med Rev. 2005 Aug;9(4):253-68. doi: 10.1016/j.smrv.2005.01.005. Sleep Med Rev. 2005. PMID: 15979356 Review.
Cited by
-
Partial sleep deprivation by environmental noise increases food intake and body weight in obesity-resistant rats.Obesity (Silver Spring). 2013 Jul;21(7):1396-405. doi: 10.1002/oby.20182. Epub 2013 May 13. Obesity (Silver Spring). 2013. PMID: 23666828 Free PMC article.
-
Animal models of narcolepsy.CNS Neurol Disord Drug Targets. 2009 Aug;8(4):296-308. doi: 10.2174/187152709788921717. CNS Neurol Disord Drug Targets. 2009. PMID: 19689311 Free PMC article.
-
Analysis of stochastic fluctuations in responsiveness is a critical step toward personalized anesthesia.Elife. 2019 Dec 3;8:e50143. doi: 10.7554/eLife.50143. Elife. 2019. PMID: 31793434 Free PMC article.
-
Animal models of sleep disorders.Comp Med. 2013 Apr;63(2):91-104. Comp Med. 2013. PMID: 23582416 Free PMC article. Review.
-
Sleep-Wake Cycling and Energy Conservation: Role of Hypocretin and the Lateral Hypothalamus in Dynamic State-Dependent Resource Optimization.Front Neurol. 2018 Oct 5;9:790. doi: 10.3389/fneur.2018.00790. eCollection 2018. Front Neurol. 2018. PMID: 30344503 Free PMC article. Review.
References
-
- Akiyama M, Yuasa T, Hayasaka N, Horikawa K, Sakurai T, Shibata S. Reduced food anticipatory activity in genetically orexin (hypocretin) neuron-ablated mice. Eur J Neurosci. 2004;20:3054–3062. - PubMed
-
- Arnulf I, Lin L, Zhang J, Russell IJ, Ripley B, Einen M, Nevsimalova S, Bassetti C, Bourgin P, Nishino S, Mignot E. CSF versus serum leptin in narcolepsy: is there an effect of hypocretin deficiency? Sleep. 2006;29:1017–1024. - PubMed
-
- Asakawa A, Inui A, Goto K, Yuzuriha H, Takimoto Y, Inui T, Katsuura G, Fujino MA, Meguid MM, Kasuga M. Effects of agouti-related protein, orexin and melanin-concentrating hormone on oxygen consumption in mice. Int J Mol Med. 2002;10:523–525. - PubMed
-
- Beuckmann CT, Yanagisawa M. Orexins: from neuropeptides to energy homeostasis and sleep/wake regulation. J Mol Med. 2002;80:329–342. - PubMed
Publication types
MeSH terms
Substances
Grants and funding
LinkOut - more resources
Full Text Sources
Other Literature Sources
Molecular Biology Databases

