Comparative Study
. 2007 Jun 15;581(Pt 3):941-60.
doi: 10.1113/jphysiol.2007.128454. Epub 2007 Mar 22.

Kv2 subunits underlie slowly inactivating potassium current in rat neocortical pyramidal neurons

Affiliations
Comparative Study

Kv2 subunits underlie slowly inactivating potassium current in rat neocortical pyramidal neurons

D Guan et al. J Physiol. .

Abstract

We determined the expression of Kv2 channel subunits in rat somatosensory and motor cortex and tested for the contributions of Kv2 subunits to slowly inactivating K+ currents in supragranular pyramidal neurons. Single cell RT-PCR showed that virtually all pyramidal cells expressed Kv2.1 mRNA and approximately 80% expressed Kv2.2 mRNA. Immunocytochemistry revealed striking differences in the distribution of Kv2.1 and Kv2.2 subunits. Kv2.1 subunits were clustered and located on somata and proximal dendrites of all pyramidal cells. Kv2.2 subunits were primarily distributed on large apical dendrites of a subset of pyramidal cells from deep layers. We used two methods for isolating currents through Kv2 channels after excluding contributions from Kv1 subunits: intracellular diffusion of Kv2.1 antibodies through the recording pipette and extracellular application of rStromatoxin-1 (ScTx). The Kv2.1 antibody specifically blocked the slowly inactivating K+ current by 25-50% (at 8 min), demonstrating that Kv2.1 subunits underlie much of this current in neocortical pyramidal neurons. ScTx (300 nM) also inhibited approximately 40% of the slowly inactivating K+ current. We observed occlusion between the actions of Kv2.1 antibody and ScTx. In addition, Kv2.1 antibody- and ScTx-sensitive currents demonstrated similar recovery from inactivation and voltage dependence and kinetics of activation and inactivation. These data indicate that both agents targeted the same channels. Considering the localization of Kv2.1 and 2.2 subunits, currents from truncated dissociated cells are probably dominated by Kv2.1 subunits. Compared with Kv2.1 currents in expression systems, the Kv2.1 current in neocortical pyramidal cells activated and inactivated at relatively negative potentials and was very sensitive to holding potential.


Figures

Figure 1
Figure 1
Single cell RT-PCR A, gel for a single layer II/III pyramidal cell from a P28 rat. This cell expressed mRNA for CamKII (marker for pyramidal cells), Kv2.1 and Kv2.2. STD, standards. B, histograms to show population data for Kv2 mRNA. Numbers above bars = number of cells. Virtually all pyramidal cells express mRNA for Kv2.1 and most for Kv2.2.
Figure 2
Figure 2
Localization of Kv2.1 and Kv2.2 subunits A–C, layer V of somatosensory cortex (P35 rat). Scale bar in B refers to A–C. A, confocal image of single 1 μm section with fluorescent staining for monoclonal anti-Kv2.1 (Neuromab: green). Kv2.1 is patchy and distributed on somata and proximal apical dendrites (mostly < 50 μm from soma) of all pyramidal cells. B, polyclonal anti-Kv2.2 (Phosphosolutions: red) Note Kv2.2 is largely restricted to large dendritic shafts. Arrows point out the same dendrites indicated by arrows in C. C, superimposed Kv2.1 and Kv2.2. In a few cases, Kv2.2-positive (red) dendrites are in continuity with Kv2.1-positive (green) dendrites (e.g. arrows). D, layer 3 of somatosensory cortex (different P35 animal). Confocal image of single 1 μm section with superimposed fluorescent staining for monoclonal anti-Kv2.1 (green) and polyclonal anti-Kv2.2 (red). Kv2.2 stains some dendrites, which are en passant from deeper layers (we could not match layer 3 pyramidal cell somata with anti-Kv2.2-stained dendrites). Scale bar = 20 μm. E, EM image of Kv2.2 localization in dendritic spine (between arrows). F, at the EM level, much of the Kv2.2 staining was within the cytoplasm of pyramidal cell apical dendrites. The staining appeared vesicular (e.g. arrows).
Figure 3
Figure 3
TEA, Cd2+ and holding potential sensitivities of the outward K+ currents α-DTX and MgTX were used in all external solutions to exclude the currents associated with Kv1 channels. Data are presented as mean ± s.e.m.A, example of the K+ current recorded from a holding potential of − 80 mV. 30-mM TEA inhibited a large, slowly activating current component. B, the dose–response relationship for TEA inhibition from holding potential of −80 mV. Over 80% of the outward K+ current was TEA sensitive, with an IC50 of 10.3 mm. nH, Hill coefficient. C, when the holding potential was changed to −40 mV from −80 mV, most outward K+ current was inactivated. *Statistical significance (P < 0.05). D, from a holding potential of −40 mV, the small, non-inactivated, outward K+ current was TEA sensitive, with an IC50 of 1.5 mm. E, representative traces for currents in response to a voltage step to +10 mV in control solution (Cd2+-free) and in the presence of 400 μm Cd2+. The subtracted record (black trace) shows that the fast, transient A current (*) was almost eliminated while the slowly inactivating current was only modestly affected by Cd2+. F, plot of conductance (G) at 200 ms versus the voltage step indicates that the voltage dependence of activation was little affected by Cd2+ (grey trace; protocol as in Fig. 5C).
Figure 5
Figure 5
Voltage-dependent activation of the anti-Kv2.1-sensitive current Outward K+ currents were activated by series of depolarizing voltages in 10 mV increments from a holding potential of –70 mV (A–D) or –90 mV (E–H). A, example of currents recorded from one pyramidal cell just after break in to whole-cell mode (P20). Note the small fast, transient current (A-type: arrow). B, currents recorded at 6 min from the same cell. Because the slowly activating current was reduced, the A-type current was more obvious (arrow). C, subtraction of records in B from those in A reveals the antibody-sensitive current (inset: voltage protocol). D, steady-state activation curves for the non-A-type current components were obtained by fitting peak current amplitudes to the Boltzmann equation. The antibody (AB)-sensitive currents (•), obtained by subtracting the currents at 6–9 min from the currents at 0 min, had a half-activation potential of +3.8 mV with a slope of 13.4 mV. The remaining current (▾) activated at more negative potentials than the AB-sensitive current (half-activation at –3 mV, slope = 14.2 mV). E, representative traces for currents just after break-in from another cell (P28). In this cell, currents were elicited by steps to various potentials after a prepulse to –90 mV for 3 s (to remove inactivation, see inset in G). F, currents in the same cell after 6 min diffusion of polyclonal anti-Kv2.1. G, subtracted records (EF) to indicate the AB-sensitive current (inset: voltage protocol). H, steady-state activation curve for averaged data from 3 cells using the protocol in G. The anti-Kv2.1-sensitive current had a V1/2 of +0.1 mV (slope, 13.2 mV). The remaining current activated at more negative potentials (V1/2, = −17 mV; slope, 15.7 mV).
Figure 4
Figure 4
Including anti-Kv2.1 in the pipette inhibited a slowly activating K+ current A, currents were elicited by a voltage step to −10 mV from a holding potential of −70 mV. These steps were repeated every 10 s. The average current in the control (filled circles) and neutralized antibody (grey triangles) groups changed little over 8 min of recording (4% change). The decline in current was more rapid at times later than 8 min. In contrast, for the group with anti-Kv2.1 in the pipette, the initial decline was much steeper and the current was reduced by an average of 33% at 8 min (significantly different from control). B, a typical example of the effects of intracellular anti-Kv2.1 on the outward K+ currents. During 6 min of intracellular diffusion, anti-Kv2.1 inhibited a persistent current (grey trace). The remaining current activated much more slowly than the anti-Kv2.1-sensitive current. C, histograms (mean ± s.e.m.) for four groups of pyramidal cells: control (without anti-Kv2.1: n = 9), anti-Kv2.1 neutralized by Kv2.1 antigen (n = 7), anti-Kv2.2 in the pipette (n = 4 cells), and anti-Kv2.1 in the pipette. Eight cells were recorded with the polyclonal anti-Kv2.1 and three cells with the monoclonal antibody. At 8 min, 38% of the outward K+ current was reduced in the group with polyclonal anti-Kv2.1 and 30% with the monoclonal anti-Kv2.1 (combined: 33%). In the group with neutralized anti-Kv2.1 or with anti-Kv2.2, current reduction was only 8%. The control current declined by 4%. *Significant difference from control value (P < 0.05: ANOVA, Tukey's multiple comparison test). D, representative traces from a cell recorded with the control internal. Note the much slower activation of the subtracted, run-down current compared with anti-Kv2.1-sensitive current in B.
Figure 6
Figure 6
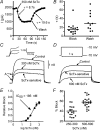
rStromatoxin (ScTx), a K+ channel blocker specific for Kv2 and Kv4 subunits, inhibited slowly inactivating K+ current The voltage protocol used to obtain A–F is shown an inset in D. A, the effects of ScTx on K+ current are reversible, allowing repetitive tests on the same cell. B, scatter plots for the time constants (τ) for block of current and subsequent reversal (wash). For doses between 250 and 600 nm, the inhibition of outward current by ScTx can be described by an exponential function of time with a mean time constant of 19 ± 4 s. Reversal of the effects of ScTx occurred with a time constant of 33 ± 6 s. C, in pyramidal neurons from some rats (especially < 3 weeks: see text), a fast, A-like component was evident in the outward current (‘A’ and inset). In these cells, ScTx blocked both the transient component and a portion of the slowly inactivating current. D, for most mature pyramidal neurons (> 4 weeks: see text), this transient component was not prominent and no transient component is evident in the ScTx-sensitive current. Inset: voltage protocol. E, dose–response curve for ScTx. The relative block of the outward K+ current by ScTx increases continuously with ScTx concentration. The effects by ScTx can be well fitted with a single Langmuir isotherm with an IC50 of 186 nm. The data are plotted as mean ± s.e.m.F, the scatter plots show that percentage block of the outward K+ current by ScTx was variable. Block by 500–600 nm ScTx varied from 41% to 79%, with a mean of 58 ± 2%. The mean values are indicated by horizontal lines.
Figure 7
Figure 7
Intracellular anti-Kv2.1 and ScTx both block the same Kv2.1-mediated current Currents were elicited by a 200 ms step to –10 mV from a holding potential of –70 mV (repeated every 10–30 s). Data were obtained from 5 cells with anti-Kv2.1 in the internal solution and three control cells without antibody. A, representative traces for a single cell for current just after break in to whole-cell mode, an initial application of 300 nm ScTx (2 min after break in) and subsequent wash out of ScTx (5 min after break in). Note the large block of current by ScTx and partial recovery. Recovery was not complete because continued perfusion of anti-Kv2.1 blocked current. B, traces from the same cell after 15 min of perfusion of anti-Kv2.1 and re-application of 300 nm ScTx. ScTx blocked less current after 15 min perfusion of anti-Kv2.1. C, subtracted records show the current blocked by the first application of ScTx (ScTx-sensitive) and current blocked by 15 min perfusion of anti-Kv2.1. The kinetics of the currents are strikingly similar, except that ScTx also blocked a fast transient current (*a small amount of transient current is also evident in the anti-Kv2.1 trace, probably due to run-down). D, summary data for ScTx effects in 3 control cells and 5 cells tested with anti-Kv2.1. Left, repeated application of 300 nm (○) or 600 nm ScTx (•) in control cells (no antibody) revealed little change in current blocked (left). Middle, in contrast, the amount of current blocked by ScTx was greatly reduced by perfusion with anti-Kv2.1 (at 8–12 min). Data from individual cells are indicated by the same symbol and a line between the points. Right, amount of current blocked by anti-Kv2.1 perfusion. There was a strong correlation between the amount of current blocked by anti-Kv2.1 perfusion and the amplitude of the decrease in ScTx block with time (Pearson r = 0.9874). The effects of ScTx and anti-Kv2.1 for the same cells are indicated by the same symbols.
Figure 8
Figure 8
Voltage-dependent inhibition by ScTx and activation of ScTx-sensitive current Currents were elicited by a series of voltage steps from −60 mV to +30 mV, repeated at 10 s intervals. The holding potential was −70 mV. A, a typical example of currents recorded in the control solution (P28). B, currents recorded from the same cell after application of 600 nM ScTx. The ScTx-insensitive currents activate more slowly than the ScTx-sensitive current. C, ScTx-sensitive current was obtained by subtraction of traces in B from those in A. Note the similarity in kinetics to the anti-Kv2.1-sensitive current in Fig. 4B. One exception is that the ScTx-sensitive current elicited by the step to +30 mV showed a rapid decline in amplitude during the step. This finding is consistent with known, voltage-dependent effects of ScTx. D, voltage protocol for A–C. E, voltage dependence of ScTx effects. Percentage block at 20 ms and 200 ms for voltage steps to several potentials. At potentials depolarized to −10 mV, the percentage block at 20 ms is reduced. This is more dramatic at 200 ms into the step than at 20 ms, reflecting the kinetics of the voltage-dependent reversal of the ScTx effect. F, steady-state activation curve for the slowly activating, ScTx-sensitive currents. Peak G is plotted for averaged data from 4 cells without a detectable A current (mean ± s.e.m.). The half-activation potential for the ScTx-sensitive current was −3 mV (slope, 10.5 mV).
Figure 9
Figure 9
Reversal potenial and activation and deactivation kinetics of the K+ currents sensitive to polyclonal anti-Kv2.1 or ScTx (600 nM) Time constants were obtained by fitting currents with a single exponential function. A, an example of tail currents sensitive to 600 nm ScTx (P20). The tail currents were elicited by a series of different voltages stepped down from a 200 ms activating potential step of –10 mV (inset). B, both the ScTx-sensitive and –insensitive current components reversed polarity near EK (3 mm K+). The reversal potential also shifted in a Nernstian manner with elevated extracellular K+ (50 mm K+). These data indicate that the channels underlying the ScTx-sensitive and –insensitive currents are very potassium selective. C, activation and deactivation time constants for the ScTx-sensitive and ScTx-insensitive currents. ScTx-sensitive and –insensitive currents have similar kinetics at negative potentials, with the ScTx-insensitive currents being slower at potentials depolarized to ∼−20 mV. D, the activation and deactivation time constants of the ScTx-sensitive and the anti-Kv2.1-sensitive currents were very similar over the entire voltage range tested.
Figure 10
Figure 10
Inactivation of ScTx-sensitive currents A, current traces elicited by 1–3 s voltage steps to −10 mV from a holding potential of −70 mV (protocol below traces). Shown are a control trace and currents sensitive and insensitive to 600 nm ScTx (note difference in kinetics between ScTx-sensitive and -insensitive currents) (P30). B, box plot summarizing the time constant (τ) for inactivation determined by fitting the current decline (at −10 mV) with an exponential function. The inactivation time constants for the ScTx-sensitive current were between 2 and 26 s, with a median at 5.2 s (n = 11 cells). For the AB-sensitive current, median τ was 4.5 s (n = 5 cells). C, holding potential sensitivity of ScTx-sensitive and -insensitive currents. Currents were elicited by a step from −70 to −10 mV (200 ms; not shown). The stimulus was repeated at 10 s intervals. Holding potential was then changed to −40 mV. The plots show the amplitude of currents elicited by the test stimulus as a function of time after the holding potential change. The peak amplitude of the ScTx-sensitive currents decreased with time at −40 mV. The changes were well fitted by an exponential function, with a time constant of 2.5 ± 0.3 s. The ScTx-sensitive currents elicited from the −40 mV holding potential were much smaller than the currents recorded from −80 mV holding potential. This strong holding potential dependence of the ScTx-sensitive current is similar to the TEA-sensitive currents (Fig. 3). D, representative traces for steady-state inactivation of ScTx-sensitive current after 5 s inactivation at various potentials from −100 mV to −20 mV (P30). Voltage protocol is shown as inset below. A series of 5 s inactivation voltage steps of varied potentials were delivered from a holding potential of −70 mV every 15 s and closely followed by a 400 ms test voltage step to −10 mV. E, steady-state inactivation curves were obtained by fitting the averaged recordings from 10 cells with the Boltzmann equation. The ScTx-sensitive currents (•) had a half-inactivation potential of −60 mV (slope, 12.5 mV). Average data from 6 cells where steady-state inactivation was tested for the polyclonal anti-Kv2.1-sensitive current are illustrated by open squares (P30; V1/2 = − 62 mV, slope = 11.5 mV). The data are very similar to the ScTx-sensitive currents. Most of the ScTx-insensitive current (▪) did not inactivate with this protocol. The half-inactivation potential for the ScTx-insensitive component that did inactivate was −87 mV. F, scatter plots summarizing the half-inactivation and slope data for ScTx-sensitive and anti-Kv2.1 (AB)-sensitive current. The data are very similar for the two ways of isolating Kv2.1 currents.
Figure 11
Figure 11
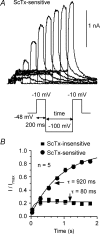
Recovery from inactivation of the ScTx-sensitive currents was tested in 5 cells using a protocol shown in the lower part of A The currents were inactivated at a holding potential of −48 mV. A 200 ms test pulse of −10 mV was delivered and followed by a recovery voltage step of −100 mV. The duration of the recovery voltage step varied from 0.02 to 1.77 s with increments of 0.25 s. A second test pulse of −10 mV was delivered after the recovery voltage step. Currents in response to the second test pulse were analysed relative to the first test step. A, typical example of the recovered ScTx-sensitive currents (P30). B, the peak recovered ScTx-sensitive currents can be well fitted by an exponential function, yielding a recovery time constant of 920 ms. Similar data were obtained for the AB-sensitive current (see text). The recovery time constant for the ScTx-insensitive component was 170 ms.

Similar articles

Cited by

References

    1. Antonucci DE, Lim ST, Vassanelli S, Trimmer JS. Dynamic localization and clustering of dendritic Kv2.1 voltage-dependent potassium channels in developing hippocampal neurons. Neuroscience. 2001;108:69–81. - PubMed
    1. Archer SL, Souil E, Dinh-Xuan AT, Schremmer B, Mercier JC, El Yaagoubi A, Nguyen-Huu L, Reeve HL, Hampl V. Molecular identification of the role of voltage-gated K+ channels, Kv1.5 and Kv2.1, in hypoxic pulmonary vasoconstriction and control of resting membrane potential in rat pulmonary myocytes. J Clin Invest. 1998;101:2319–2330. - PMC - PubMed
    1. Baranauskas G, Tkatch T, Surmeier DJ. Delayed rectifier currents in rat globus pallidus neurons are attributable to Kv2.1 and Kv3.1/3.2 K+ channels. J Neurosci. 1999;19:6394–6404. - PMC - PubMed
    1. Bekkers JM. Properties of voltage-gated potassium currents in nucleated patches from large layer 5 cortical pyramidal neurons of the rat. J Physiol. 2000a;525:593–609. - PMC - PubMed
    1. Bekkers JM. Distribution and activation of voltage-gated potassium channels in cell-attached and outside-out patches from large layer 5 cortical pyramidal neurons of the rat. J Physiol. 2000b;525:611–620. - PMC - PubMed

Publication types

MeSH terms