. 2007 Jun 1;581(Pt 2):801-17.
doi: 10.1113/jphysiol.2006.127498. Epub 2007 Mar 22.

Regulation of membrane potential and fluid secretion by Ca2+-activated K+ channels in mouse submandibular glands

Affiliations

Regulation of membrane potential and fluid secretion by Ca2+-activated K+ channels in mouse submandibular glands

Victor G Romanenko et al. J Physiol. .

Abstract

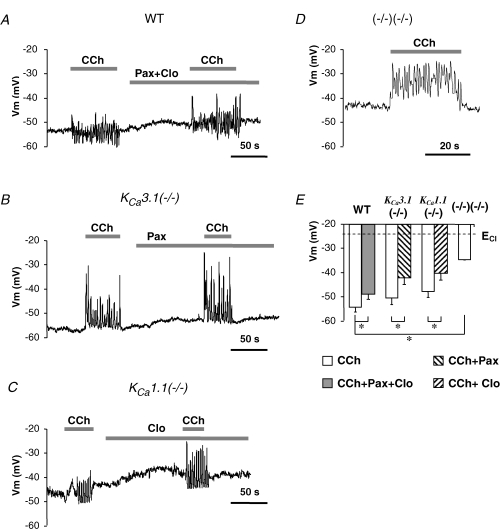
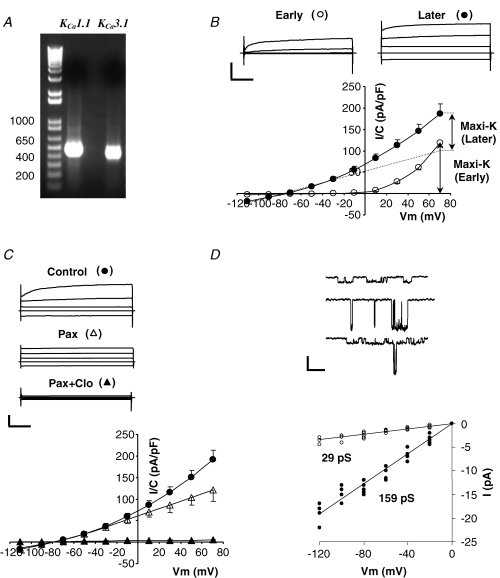
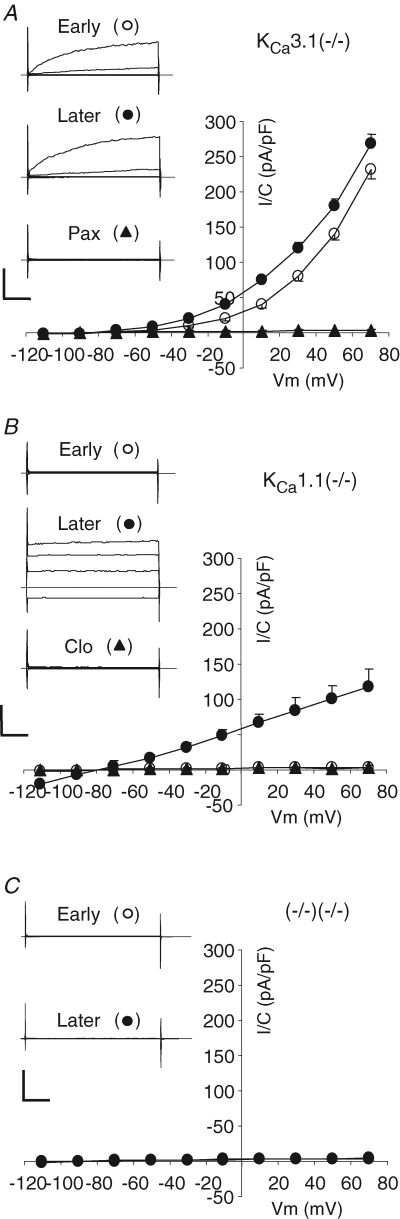
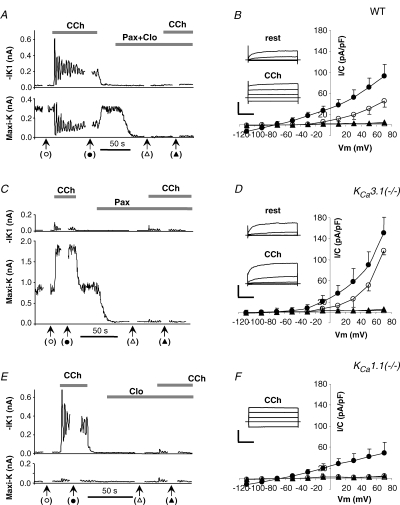
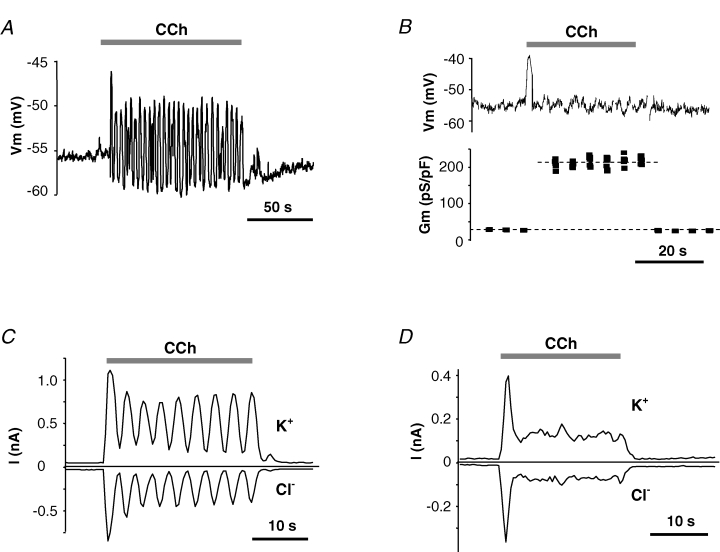
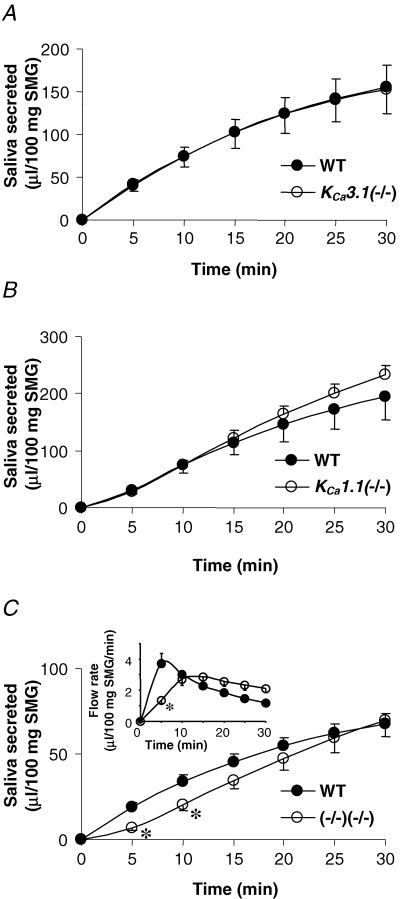
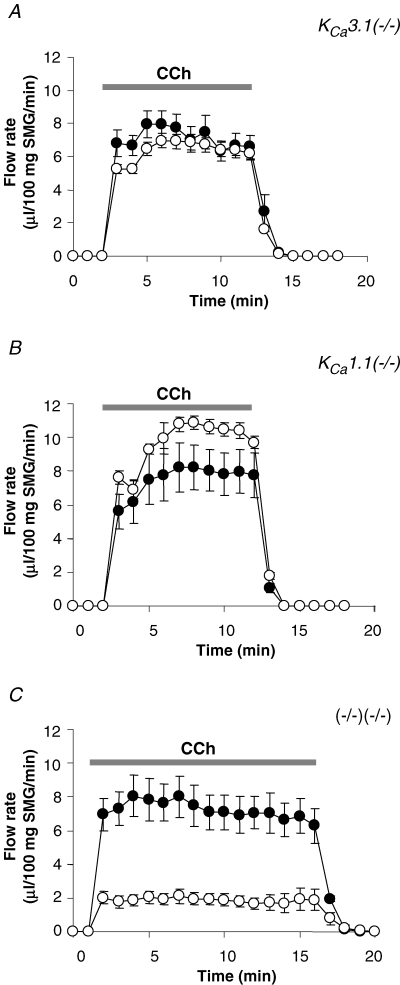
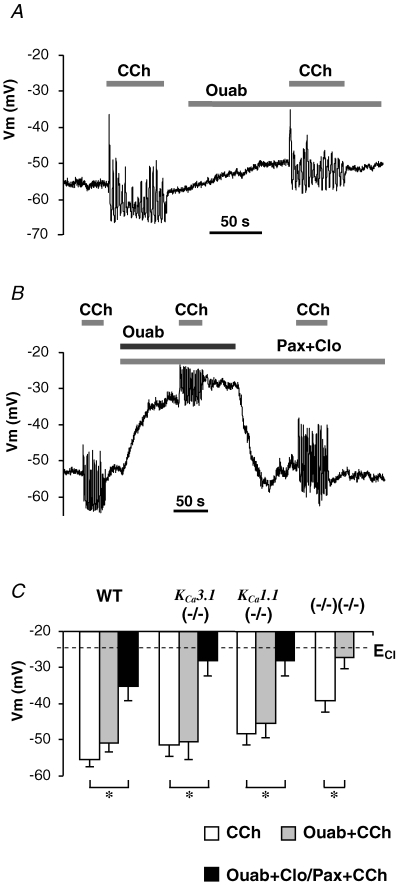
We have recently shown that the IK1 and maxi-K channels in parotid salivary gland acinar cells are encoded by the K(Ca)3.1 and K(Ca)1.1 genes, respectively, and in vivo stimulated parotid secretion is severely reduced in double-null mice. The current study tested whether submandibular acinar cell function also relies on these channels. We found that the K(+) currents in submandibular acinar cells have the biophysical and pharmacological footprints of IK1 and maxi-K channels and their molecular identities were confirmed by the loss of these currents in K(Ca)3.1- and K(Ca)1.1-null mice. Unexpectedly, the pilocarpine-stimulated in vivo fluid secretion from submandibular glands was essentially normal in double-null mice. This result and the possibility of side-effects of pilocarpine on the nervous system, led us to develop an ex vivo fluid secretion assay. Fluid secretion from the ex vivo assay was substantially (about 75%) reduced in animals with both K(+) channel genes ablated - strongly suggesting systemic complications with the in vivo assay. Additional experiments focusing on the membrane potential in isolated submandibular acinar cells revealed mechanistic details underlying fluid secretion in K(+) channel-deficient mice. The membrane potential of submandibular acinar cells from wild-type mice remained strongly hyperpolarized (-55 +/- 2 mV) relative to the Cl(-) equilibrium potential (-24 mV) during muscarinic stimulation. Similar hyperpolarizations were observed in K(Ca)3.1- and K(Ca)1.1-null mice (-51 +/- 3 and -48 +/- 3 mV, respectively), consistent with the normal fluid secretion produced ex vivo. In contrast, acinar cells from double K(Ca)3.1/K(Ca)1.1-null mice were only slightly hyperpolarized (-35 +/- 2 mV) also consistent with the ex vivo (but not in vivo) results. Finally, we found that the modest hyperpolarization of cells from the double-null mice was maintained by the electrogenic Na(+),K(+)-ATPase.


Figures

Figure 5
Figure 5. Membrane potential of submandibular acinar cells from wild-type and KCa3.1-, KCa1.1- and double-null mice
Cell were stimulated with 0.3 μm CCh with or without K+ channel blockers (with 1 μm paxillin, with 3 μm clotrimazole, or with 1 μm paxilline and 3 μm clotrimazole). A, membrane potential of a submandibular acinar cell from wild-type mice recorded in perforated-patch configuration. B–D, membrane potentials recorded in cells from KCa3.1-, KCa1.1- and double-null mice. E, time-averaged mean membrane potentials in cells from wild-type or mutant mice as indicated. *P < 0.05.
Figure 1
Figure 1. Analysis of whole-cell and single channel K+ currents in wild-type submandibular acinar cells
A, expression of mRNA of IK1 and maxi-K channels in submandibular glands from wild-type mice was determined using RT-PCR analysis. B, whole-cell currents recorded with 250 nm Ca2+ in the pipette. Currents were recorded immediately (10–20 s) after achieving whole-cell mode (Early) and after a steady level of IK1 current developed (Later, 5–10 min). Top panel, typical raw currents in response to 40 ms voltage pulses to −110, −30, +10 and +50 mV from −70 mV holding potential. Calibration bars are 1 nA and 10 ms. Bottom panel, mean current densities determined at the end of the 40 ms pulses to the indicated potentials at Early (^) and Later (•) times (n = 12). Dashed line represents the voltage-independent (IK1-like) component. C, sensitivity of whole-cell currents to the maxi-K channel inhibitor paxilline and the IK1 channel inhibitor clotrimazole. Raw traces and I–V plot are presented in the same format as in B; •– no inhibitors, ▵– with 1 μm paxillin, ▴– with 1 μm paxilline and 3 μm clotrimazole (n = 7). D, top panel, single channel recordings from 3 inside-out patches exposed to 250 nm Ca2+ with either IK1 (top patch) or maxi-K (middle patch), or both (bottom patch) channels present. Bottom panel, I–V plot of single channel IK1 (^) and maxi-K (•) currents at the indicated potentials (n = 7 cells).
Figure 2
Figure 2. Whole-cell submandibular acinar K currents in KCa3.1- and KCa1.1- and double-null mice
A, whole-cell currents in a cell from KCa3.1-null mouse recorded with 250 nm Ca2+ in the pipette. Currents were recorded immediately after achieving whole-cell mode (Early and ^) and after a steady level of IK1 current developed (Later and •) and after addition of 1 μm paxillin, a maxi-K channel inhibitor (▴). Typical raw traces and average I–V plot are presented in the same format as in Fig. 1B (n = 7). B and C, same as described in A but currents recorded in cells from KCa1.1-null mice (n = 5) and from double-null mice (n = 7). B, the identity of the developed current was tested by addition of 3 μm clotrimazole, the specific inhibitor of IK1 channel (▴).
Figure 3
Figure 3. K+ currents in resting and stimulated cells from wild-type mice and KCa3.1- and KCa1.1-null mice
IK1 and maxi-K currents were simultaneously recorded using perforated-patch mode in cells from wild-type mice (A and B), KCa3.1-null (C and D) and KCa1.1-null (E and F) mice. For A, C and E, every 0.4 s IK1 currents (upper panels) were measured at −100 mV (10 ms voltage step) and maxi-K currents (lower panels) were determined as a time-dependent component of the current elicited by 40 ms steps to +30 mV from holding potential of −60 mV. At time points indicated by the arrows in A, C and E full I–V plots were obtained. The average I–V plots in B (n = 7), D (n = 6), and F (n = 4) show K+ currents before (^) and during stimulation with 0.3 μm CCh (•) as well as after blocking K+ channels without (▵) and with (▴) stimulation. Insets of B, D and F, raw currents in response to 40 ms voltage pulses to −110, −30, +10 and +50 mV from −70 mV holding potential. Calibration bars: 1, 2 and 0.5 nA for B, D and F, respectively, versus 10 ms.
Figure 4
Figure 4. Membrane potential, membrane conductance and K+ and Cl currents in submandibular acinar cells from wild-type mice
Membrane voltage and currents were recorded in perforated-patch configuration. Stimulation with 0.3 μm CCh induced either membrane oscillations (A) or non-oscillatory responses (B, upper panel) with concurrent increase in membrane conductance (B, lower panel). Typical current traces of ‘oscillatory’ (C) and ‘non-oscillatory’ (D) cells were recorded during 10 ms steps to either −25 mV (upper traces) or to −85 mV (lower traces) with 10 ms interpulse interval applied every 0.4 s from holding potential of −60 mV.
Figure 6
Figure 6. In vivo stimulated fluid secretion from submandibular glands
A, amount of saliva secreted over 30 min from KCa3.1-null (^) and wild-type (•) mice in response to 10 mg (kg body weight)−1 of pilocarpine (n = 11 and 10 mice, respectively). B, saliva secreted from KCa1.1-null (^) and wild-type (•) mice (n = 7 and 6 mice, respectively). C, volume of saliva secreted from KCa3.1/KCa1.1-double-null (^) and wild-type (•) mice (n = 7 and 11 mice, respectively). Inset, respective average saliva flow rates calculated for 5 min time intervals. *P < 0.05.
Figure 7
Figure 7. Muscarinic-stimulated saliva secretion from isolated submandibular glands
A, saliva secretion from ex vivo submandibular glands from either wild-type or KCa3.1-null mice, the artery and main excretory duct cannulated. Secretion was stimulated by vascular perfusion with 0.5 μm CCh: •– wild-type, ^–KCa3.1-null glands (n = 8 and 9 mice, respectively). B and C, same as described for A but fluid flow rates were compared in KCa1.1-null (n = 5 mice) and double-null (n = 5 mice) glands with their wild-type controls (n = 4 and n = 4 mice, respectively).
Figure 8
Figure 8. Membrane depolarization upon inhibition of Na+,K+-ATPase
A and B, membrane potential traces recorded in wild-type cells stimulated with 0.3 μm CCh prior to or along with superfusion of ouabain alone (A) or with paxilline and clotrimazole (B). C, the mean values of Vm from cells during stimulation with no inhibitors (open bars), with K+ channel inhibitors (grey bars), or with both K+ channel inhibitors and Na+,K+-ATPase inhibitor (black bars). *P < 0.05.

Similar articles

Cited by

References

    1. Begenisich T, Nakamoto T, Ovitt CE, Nehrke K, Brugnara C, Alper SL, Melvin JE. Physiological roles of the intermediate conductance, Ca2+-activated potassium channel Kcnn4. J Biol Chem. 2004;279:47681–47687. - PubMed
    1. Bruce JI, Shuttleworth TJ, Giovannucci DR, Yule DI. Phosphorylation of inositol 1,4,5-trisphosphate receptors in parotid acinar cells. A mechanism for the synergistic effects of cAMP on Ca2+ signaling. J Biol Chem. 2002;277:1340–1348. - PubMed
    1. Bymaster FP, Carter PA, Yamada M, Gomeza J, Wess J, Hamilton SE, Nathanson NM, McKinzie DL, Felder CC. Role of specific muscarinic receptor subtypes in cholinergic parasympathomimetic responses, in vivo phosphoinositide hydrolysis, and pilocarpine-induced seizure activity. Eur J Neurosci. 2003;17:1403–1410. - PubMed
    1. Cecanho R, Anaya M, Renzi A, Menani JV, De Luca LA., Jr Sympathetic mediation of salivation induced by intracerebroventricular pilocarpine in rats. J Auton Nerv Syst. 1999;76:9–14. - PubMed
    1. Cook DI, Van Lennep EW, Roberts ML, Young JA. Secretion by the Major Salivary Glands. New York: Raven Press; 1994.

Publication types

MeSH terms